Costs report by managers is in analytics on managers section.
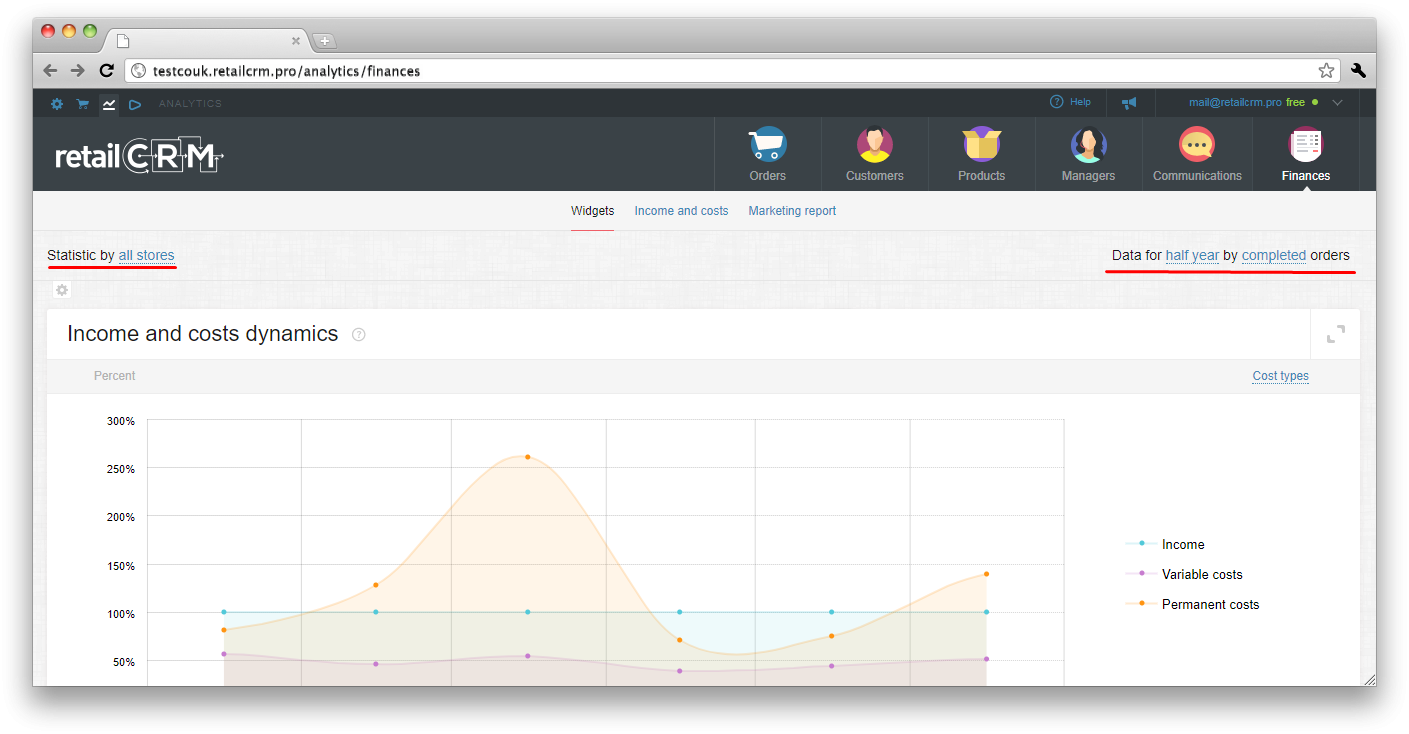
There is a global filter using which you can:
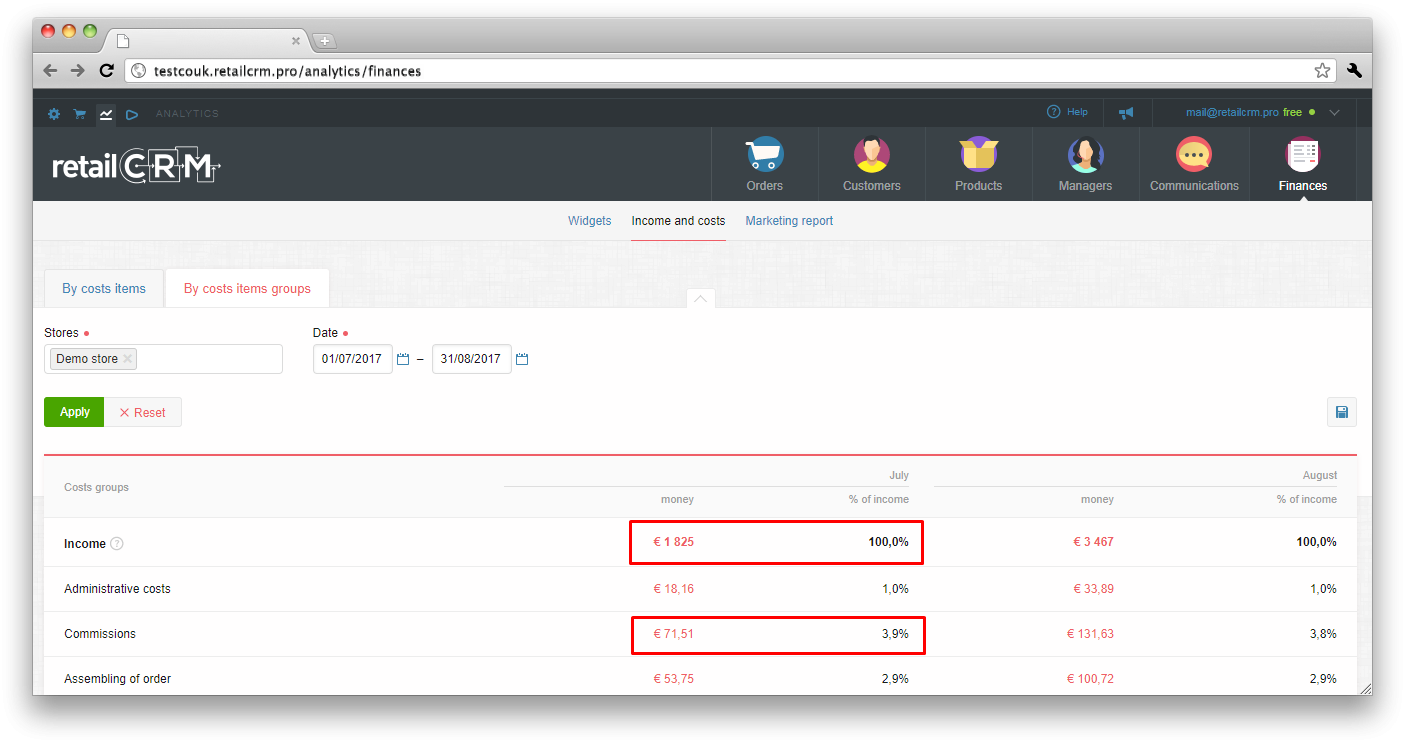
If you need data by certain date, you should select starting and ending dates in calendar and click “Done”. Period will be shown as follows:
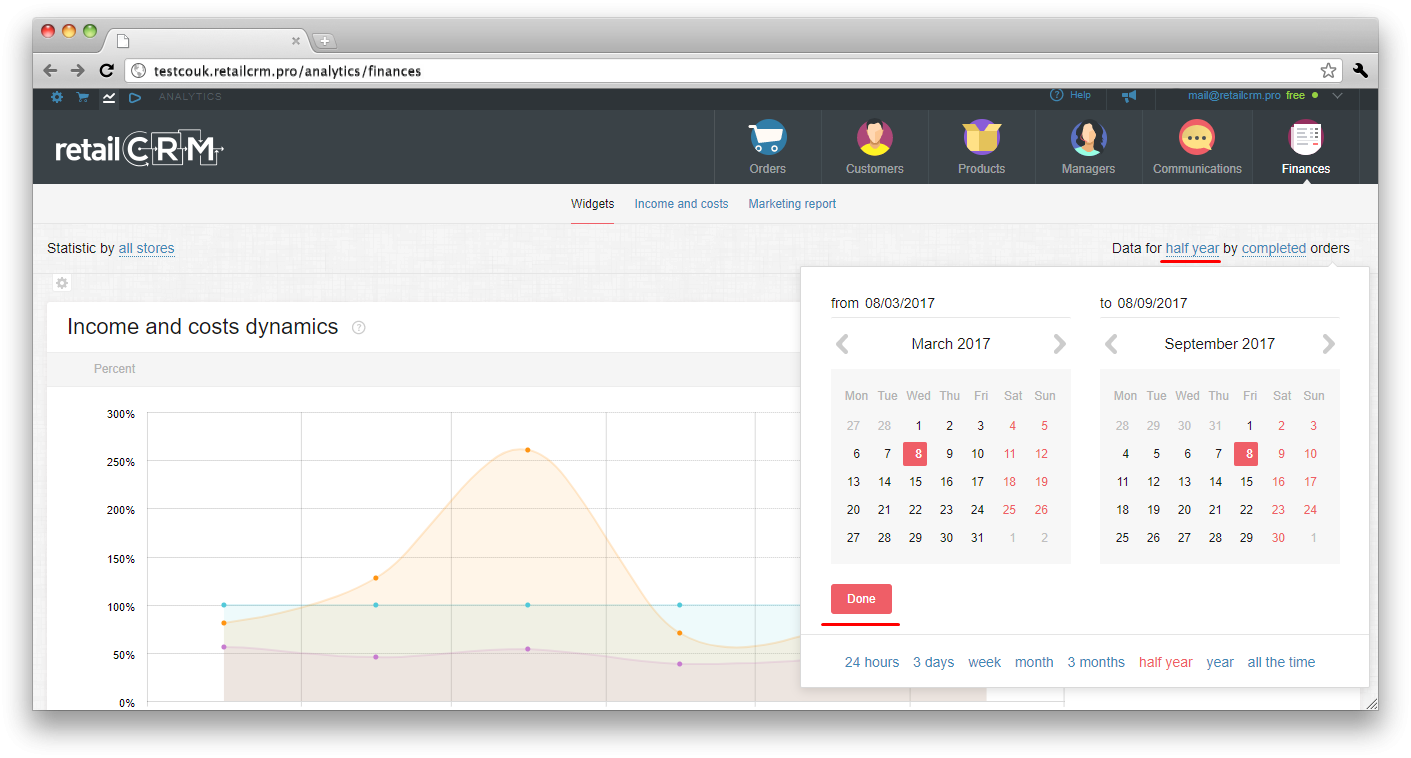
You can also choose relative date. For example, if you need data only for a month.
There is a gear icon under statistics, clicking on which you can configure the panel.
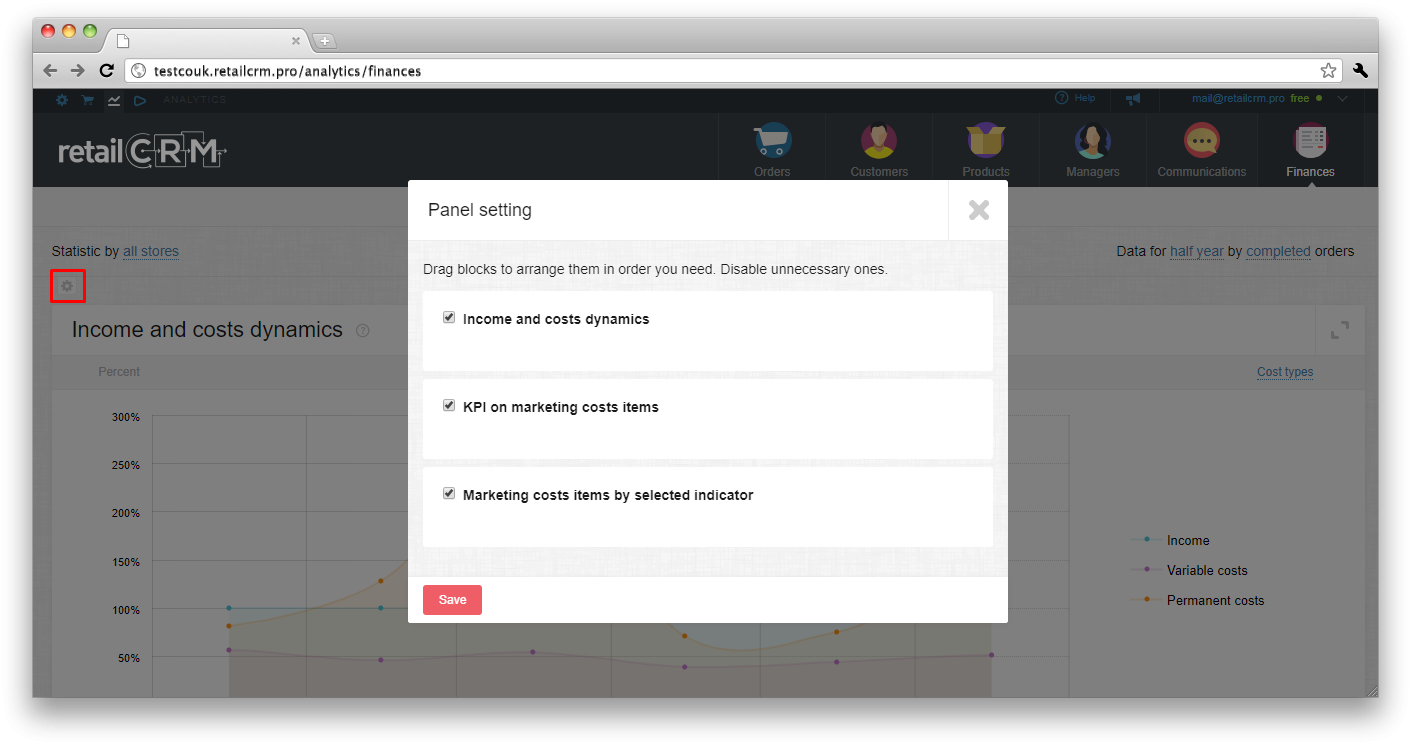
As on the screenshot, there are headings for all data in widget panel. The tick opposite each one allows to enable or disable reports on selected criteria. There is an opportunity to move blocks for arranging them in necessary ordering and to disable needless.
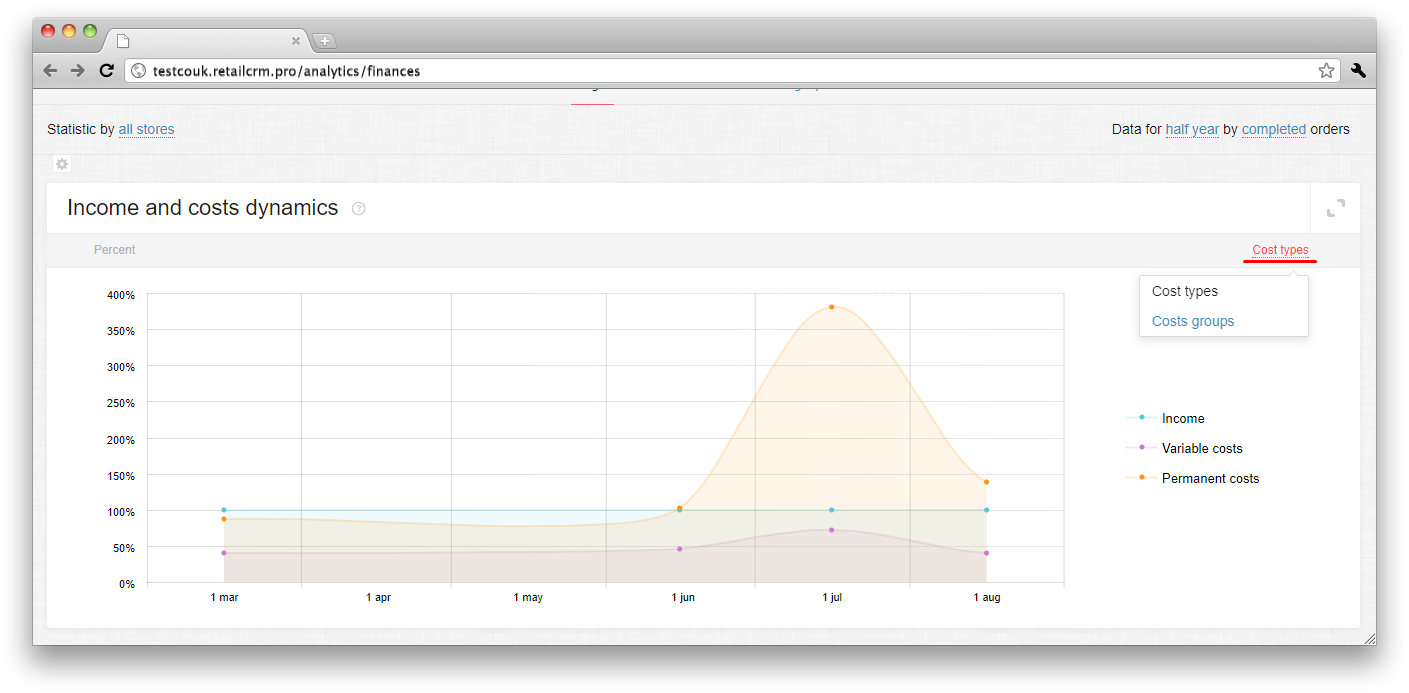
This widget displays percentages of costs and incomes by time. Sum of store incomes for selected period is taken for 100%. Costs are displayed on graph in percentage to incomes. Upper line of costs is equal to sum of all costs of store (in percentage to incomes).
If upper line of costs exceeds 100%, it means that store costs sum for this period exceeds its income. Accordingly, the store worked at a loss. You can see at graph what types/groups of costs are the reasons of loss. If upper line doesn't exceed 100%, it means that costs in this period are less than store income.
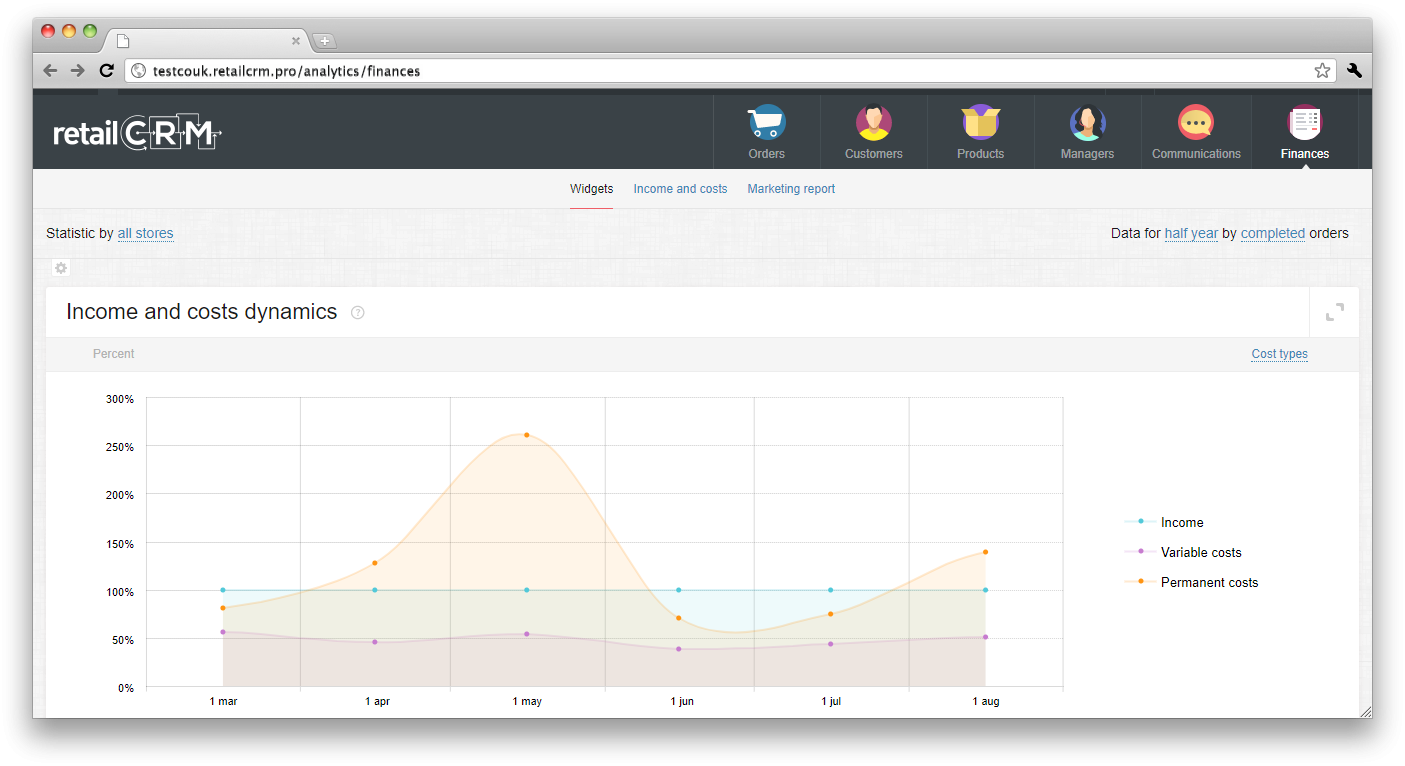
You can view the widget either by cost types (variable/permanent) or by cost groups.
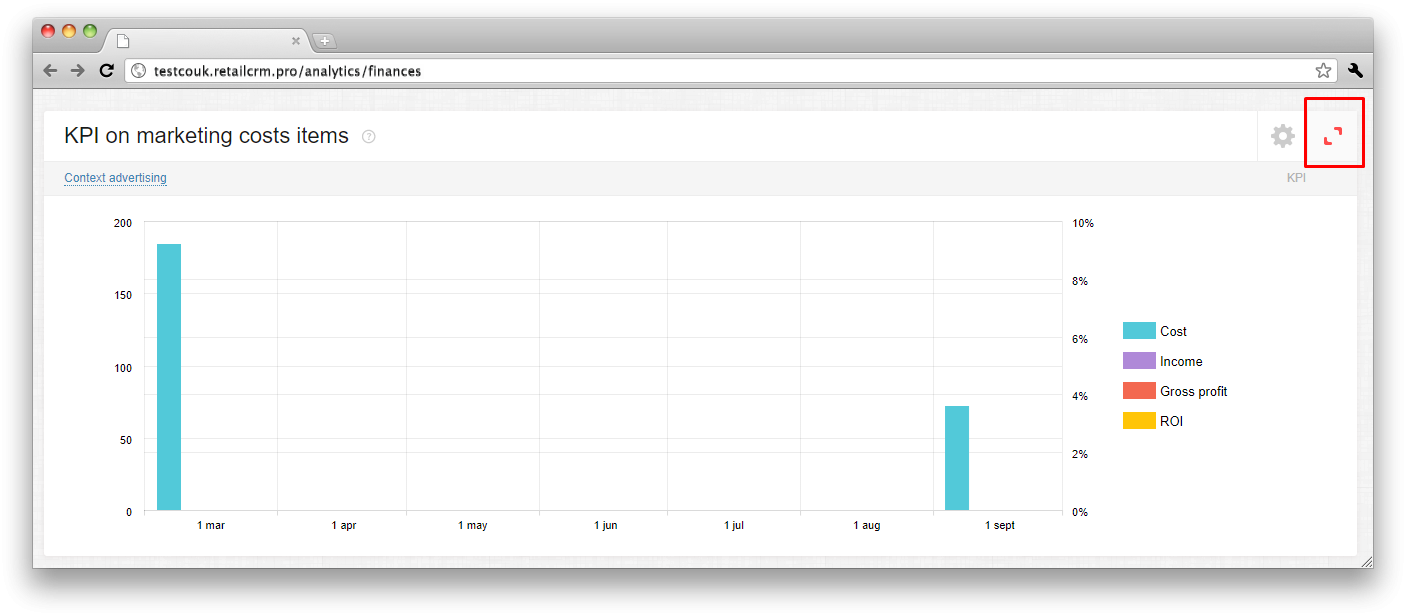
Report allows to analyze the efficiency indicators by chosen item of marketing costs.
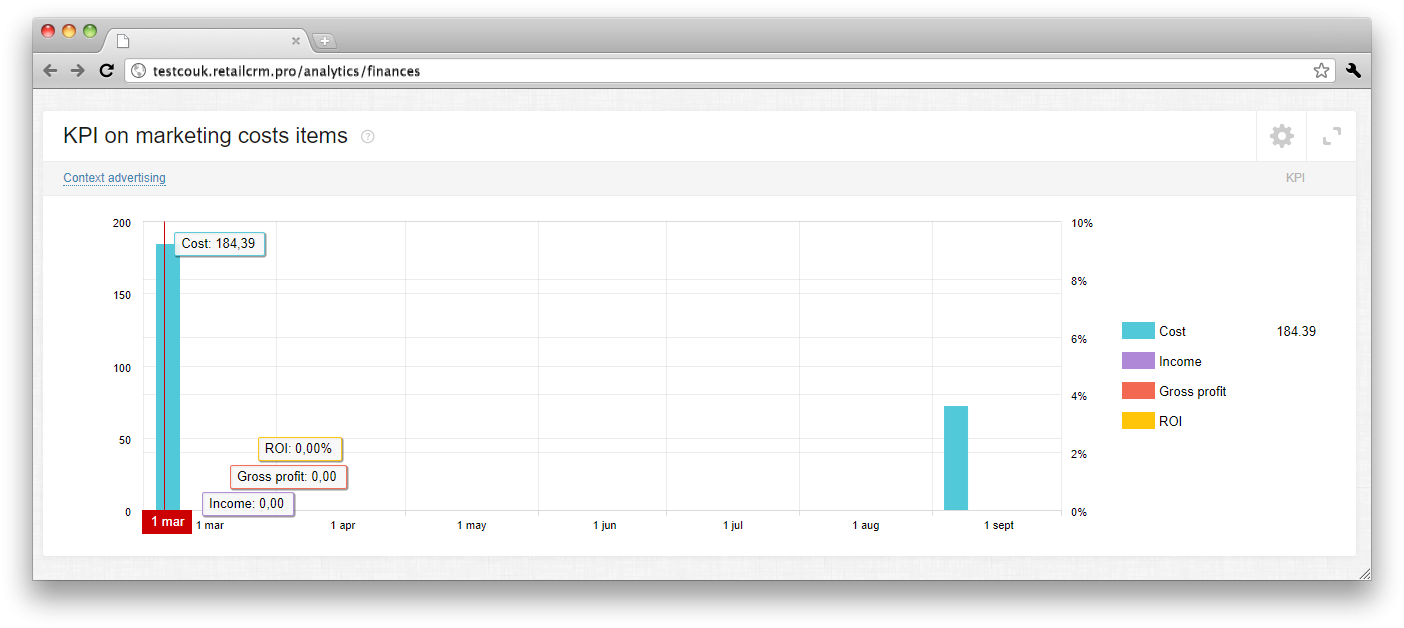
In other words you can choose one cost item in the list of parameters at the top left corner, and you will see the following indicators:
Thus the store can evaluate its costs for advertising by several indicators at the same time per specified period.
Note: ROI is being calculated as ratio of advertising cost amount to gross profit amount of the orders, came from certain source (medium, campaign, etc.). If ROI is lower than 100%, it means that advertising is not efficient (1 euro of advertising costs gives less than 1 euro of profit to the store). And contrary, if ROI is higher than 100%, it means that advertising is efficient.
There are two vertical axes in this widget - data in euro at the left one, and data in percentages at the right one.
If you click the gear icon at the top right corner of widget, the settings will be opened.
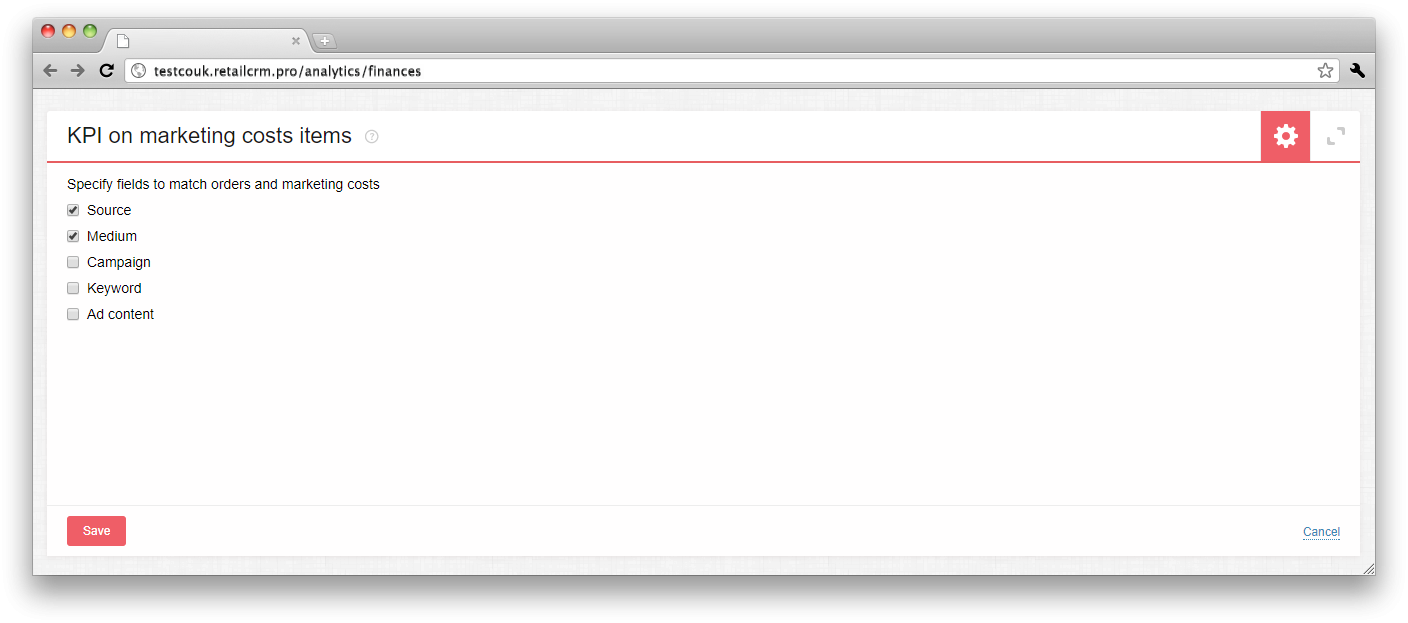
In this settings you can set the fields, by which the orders and advertising costs will be matched. There is detailing by:
If only one field is enabled (for example, Source), costs and income will be displayed by all orders came from this source independently of different mediums/campaigns, etc. The system will sum all data, based on “Source” field only. If 2 and more fields are enabled, then the system will detail costs sum and match it with orders income according to the set of enabled fields.
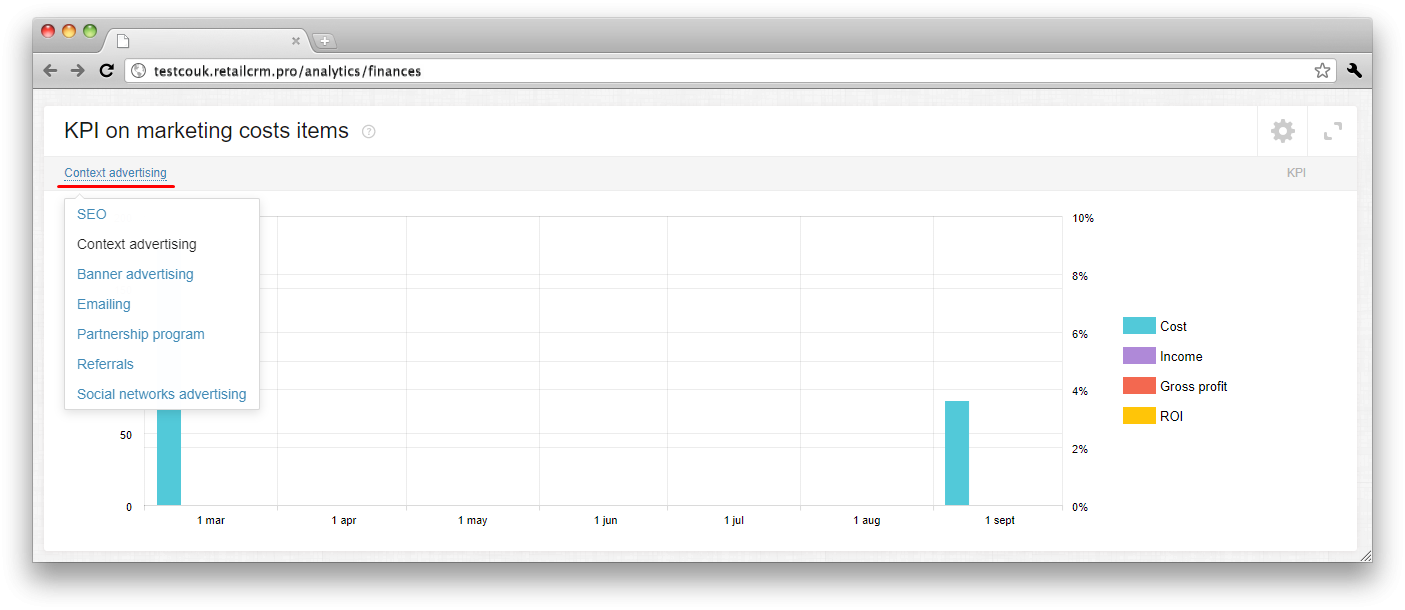
There is “extend” button near the gear. Clicking on it, you will see several reports with various cost item: SEO, Context advertising, Banner advertising, Emailing, Partnership program, Referrals, Social networks advertising.
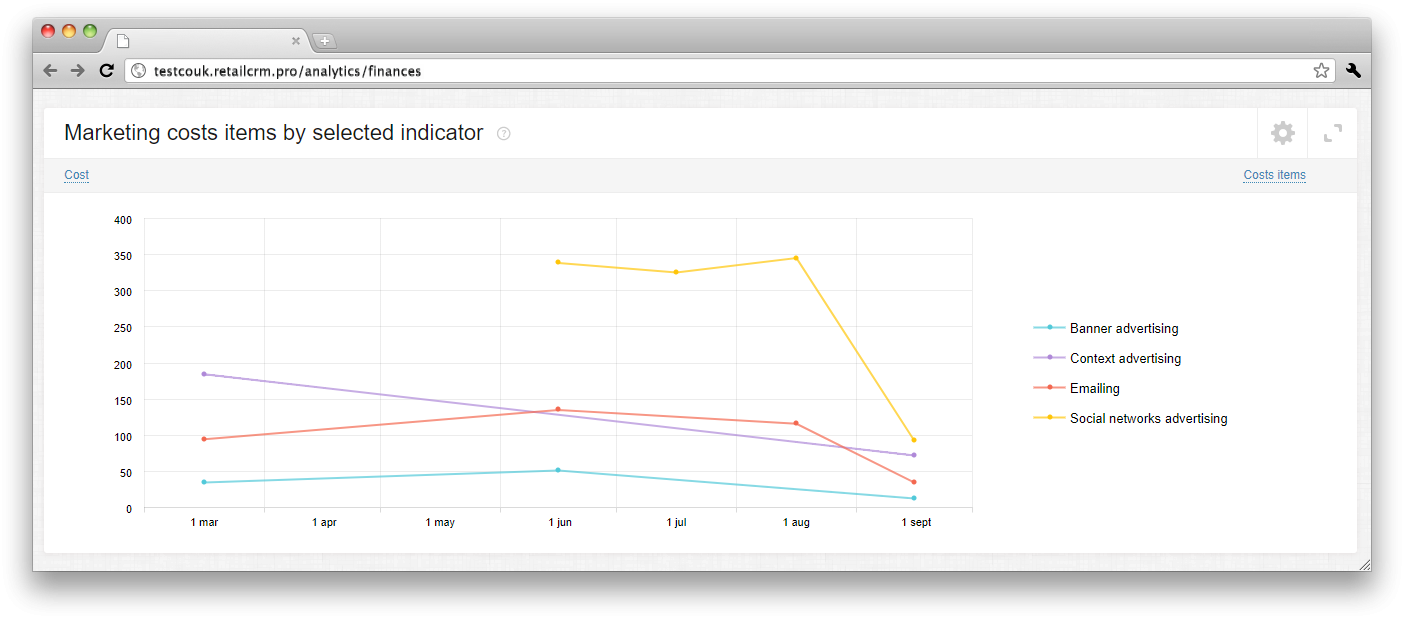
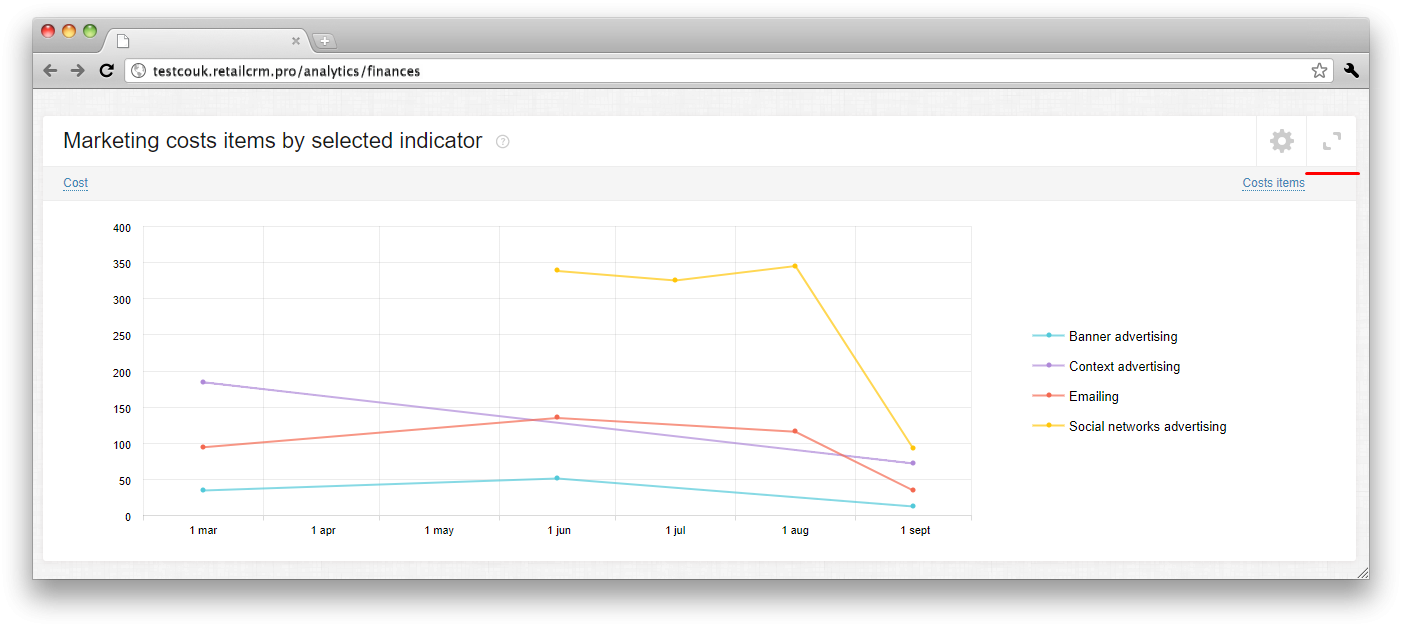
Report shows the involvement of different marketing costs items to selected indicator. In other words, user can compare efficiency of several advertising costs with each other by any indicator: Cost, Income, Profit, ROI.
If you click the gear icon at the top right corner of widget, the settings will be opened.
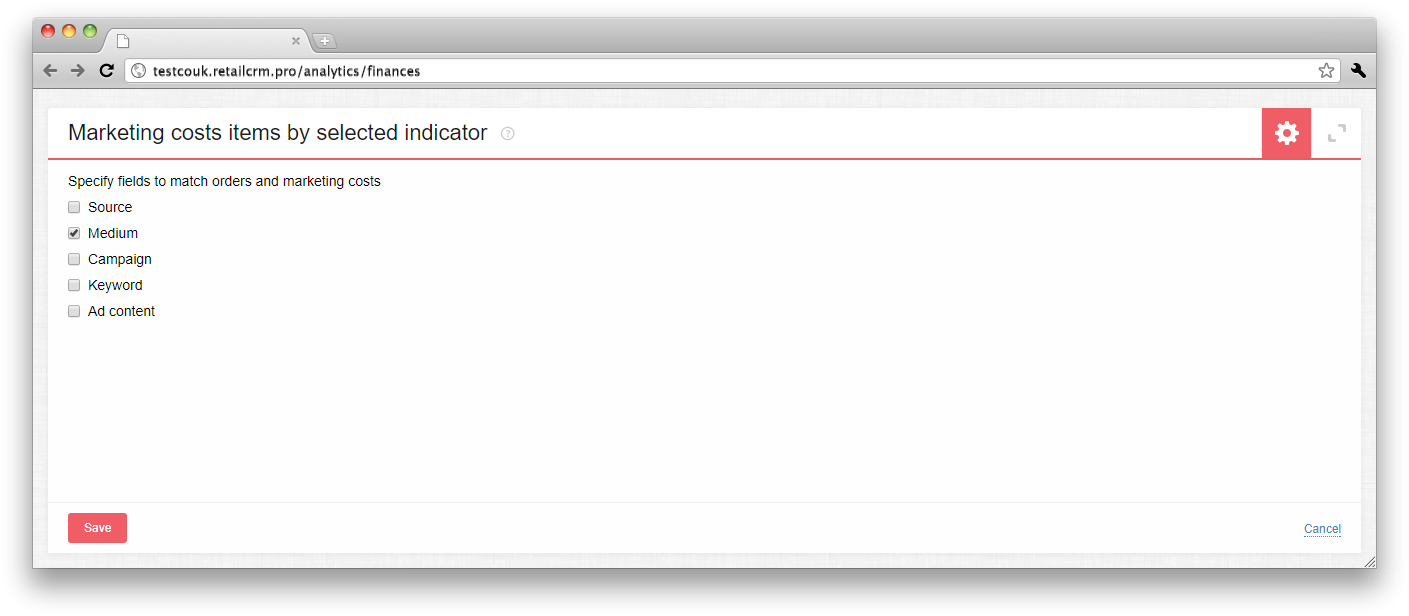
In this settings you can set the fields, by which the orders and advertising costs will be matched. There is detailing by:
If only one field is enabled (for example, Source), costs and income will be displayed by all orders came from this source independently of different mediums/campaigns, etc. The system will sum all data, based on “Source” field only. If 2 and more fields are enabled, then the system will detail costs sum and match it with orders income according to the set of enabled fields.
There is “extend” button near the gear. Clicking on it, you will see several reports with variable vertical axis: Cost, Income, Profit, ROI.
There is a common filter at the top of page.
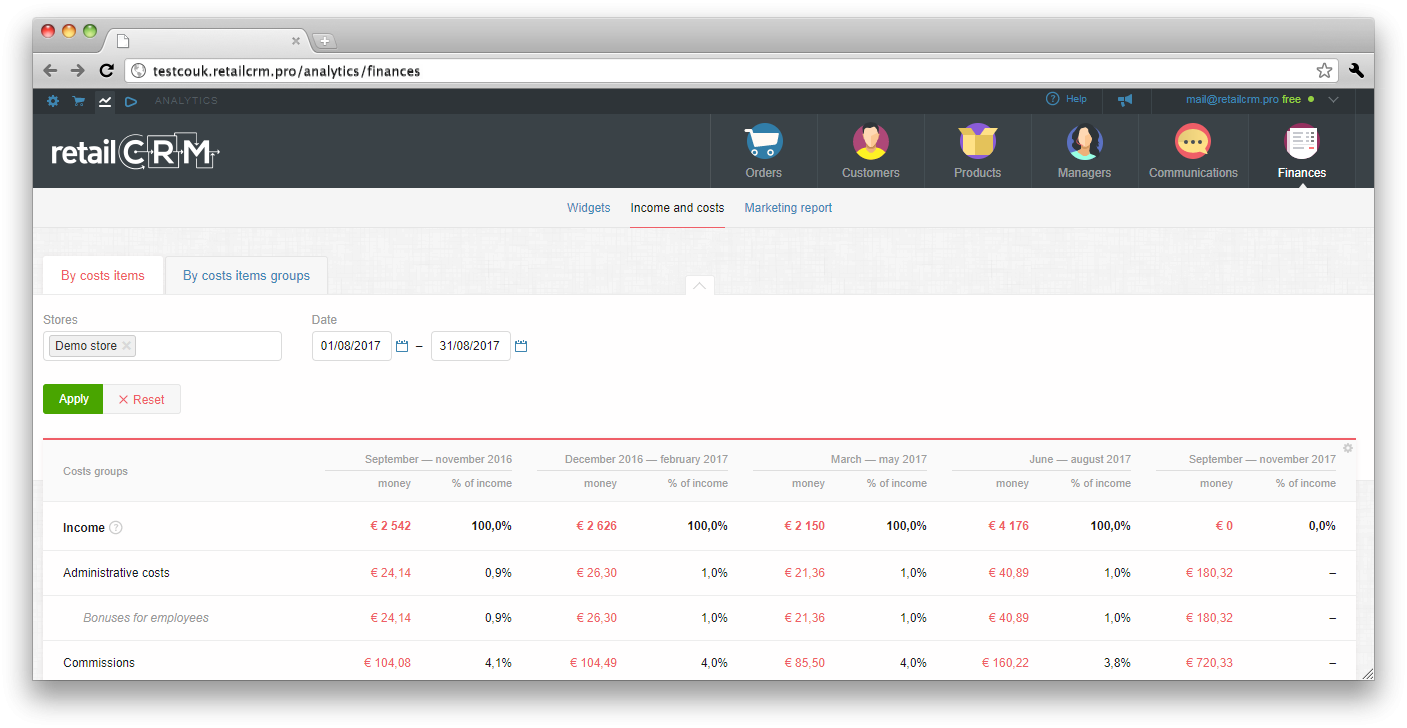
Using it, you can:
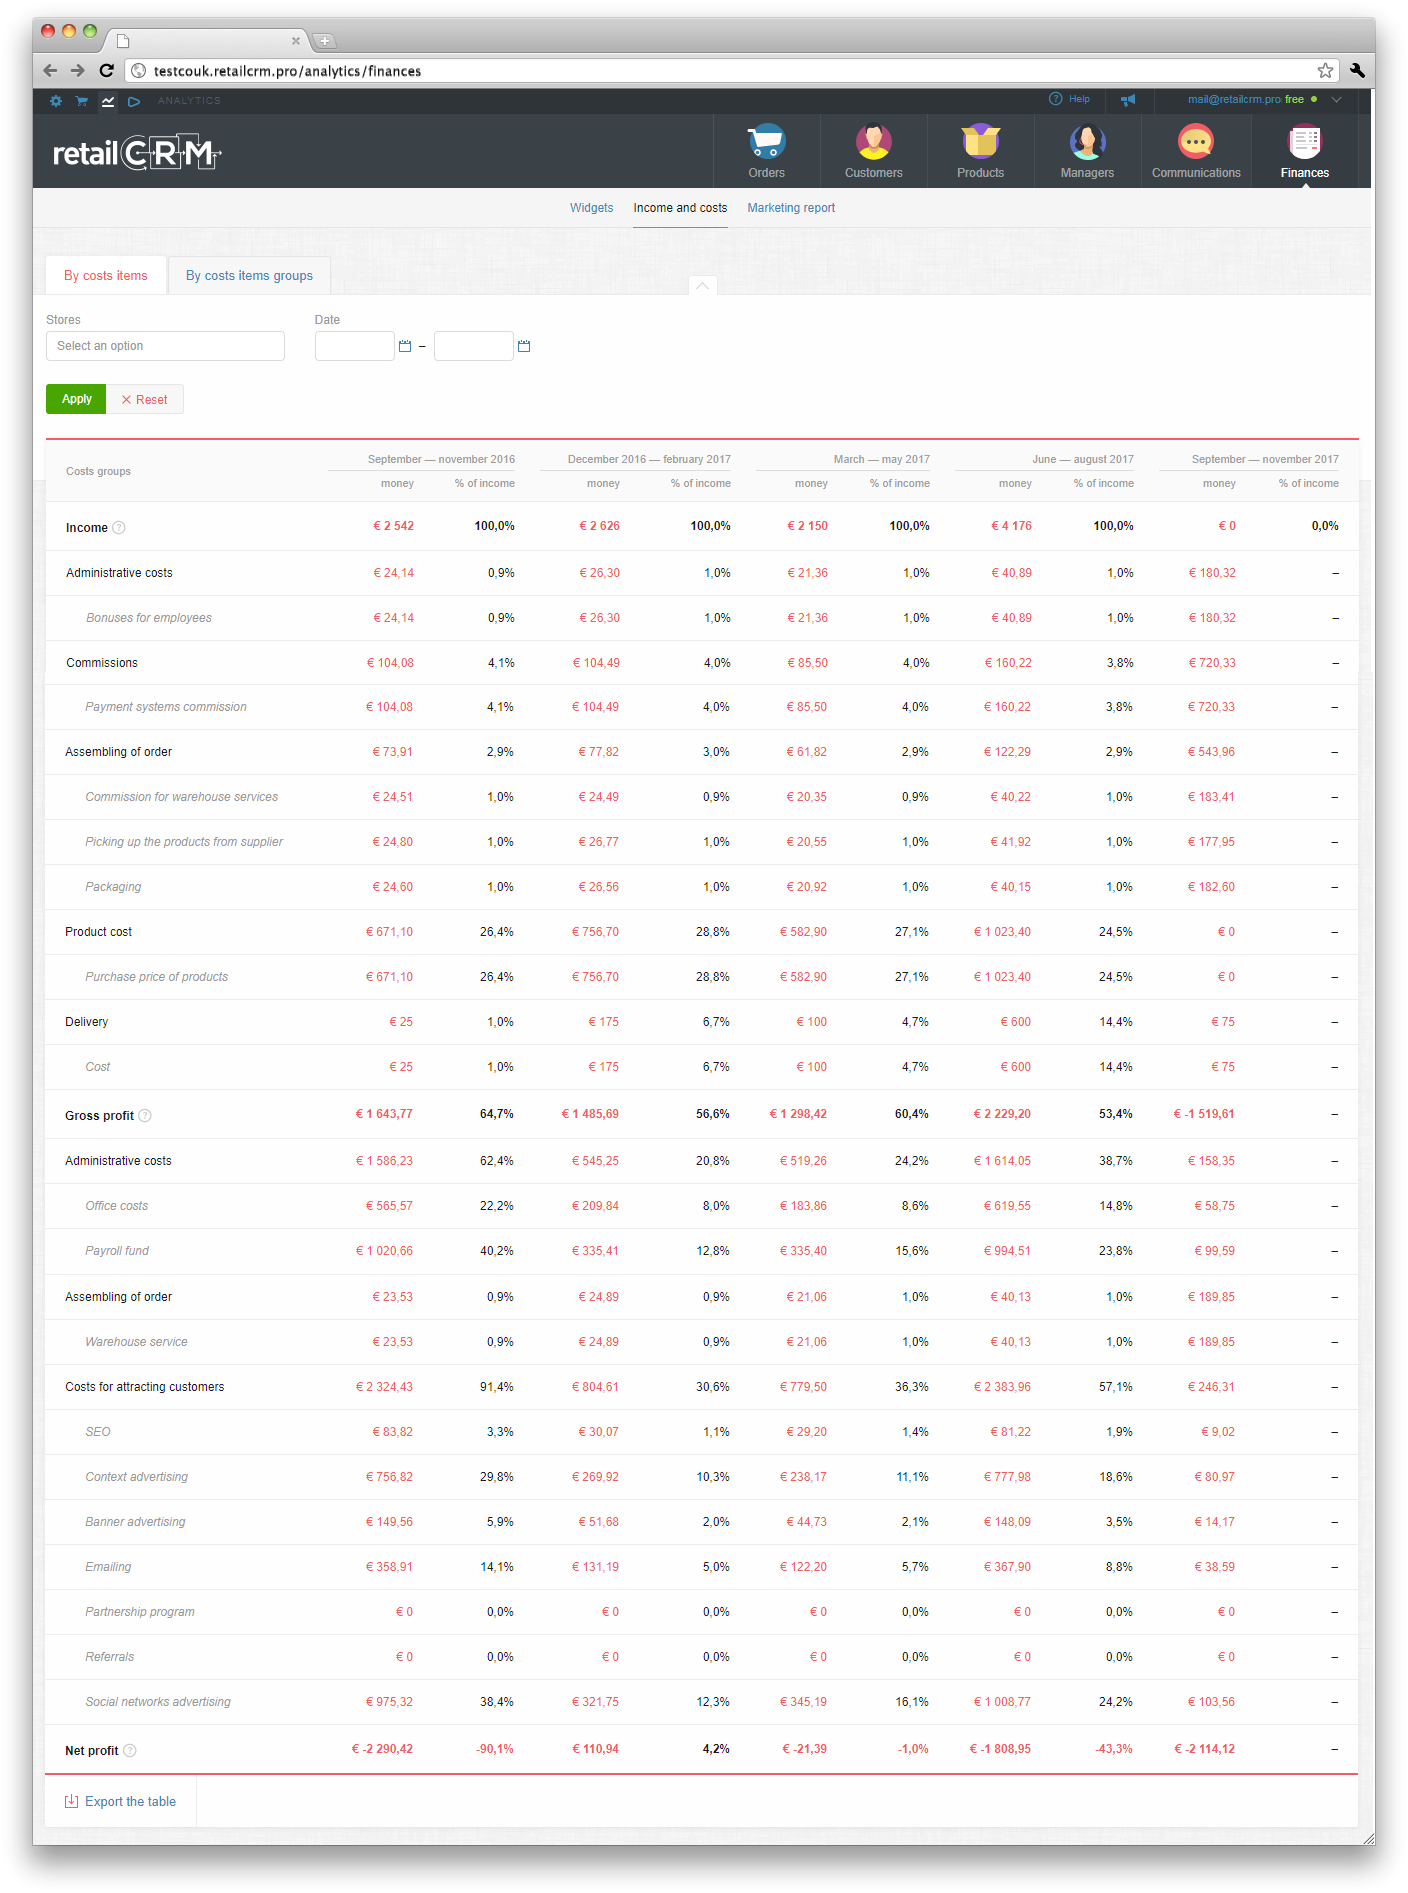
Report will be displayed in two views: by costs items (extended view) and by costs groups (cut view).
This report aggregates all data on income and costs of store and shows financial result of working with orders (profit or loss per month).
The system creates this report by the following principe: revenue and purchase price of order items are included in report at the date, when order status was changed to “Complete”. The rest costs is being distributed evenly by days of period specified in the cost.
Thus report compares income and costs in one period (not in different as it might be with costs payment moment and order completion).
Costs are divided by 2 types: Variable (before Gross Profit, they are changed together with sales volume) and Permanent (after Gross Profit, don't depend on sales volume).
Data on costs are presented in two variants: monetary or in percentage of cost item to revenue. Due to this, user can see what costs take the most part of revenue (as a rule, the biggest cost item is the product purchase price). Graphically you can see this ratio on “Income and costs dynamics” widget.
This report collects all information on advertising costs of store, income and profit by received orders from the specified sources. In other words, you can see how efficiently the store spends money for advertising, how much profit the certain sales channel gives.
There is a common filter at the top of page.
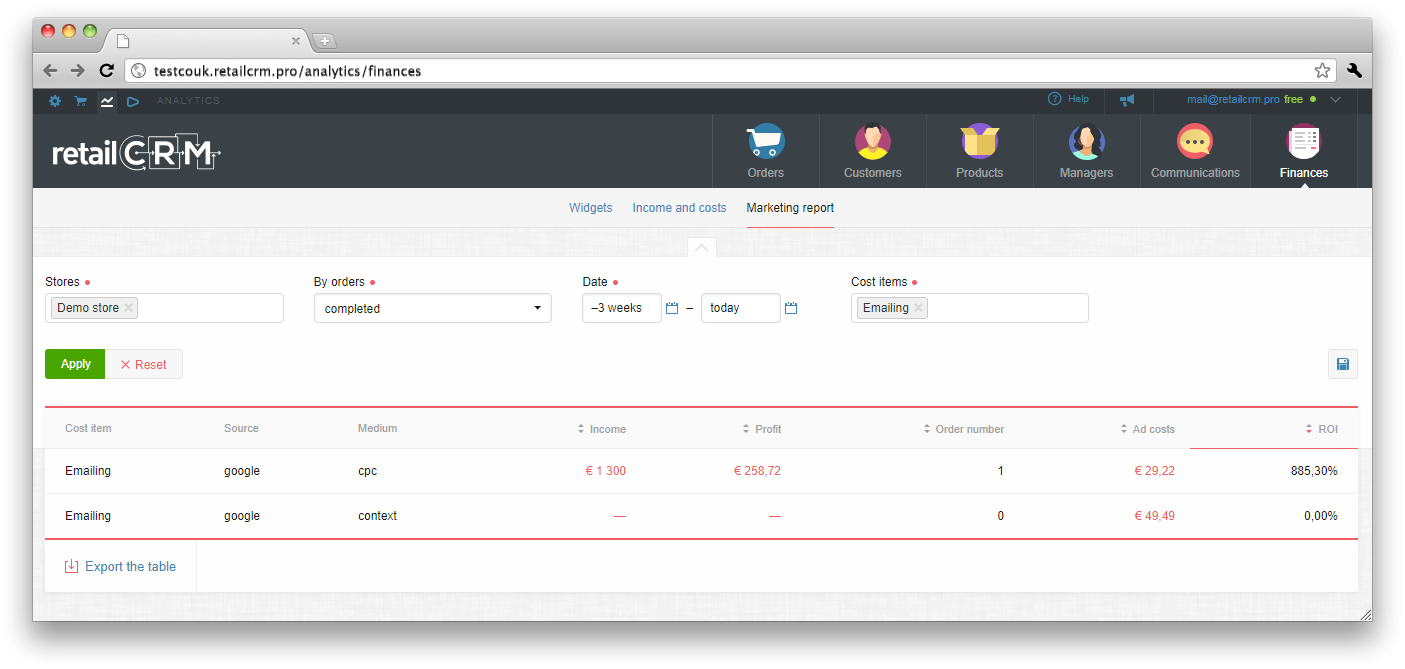
Using it, you can:
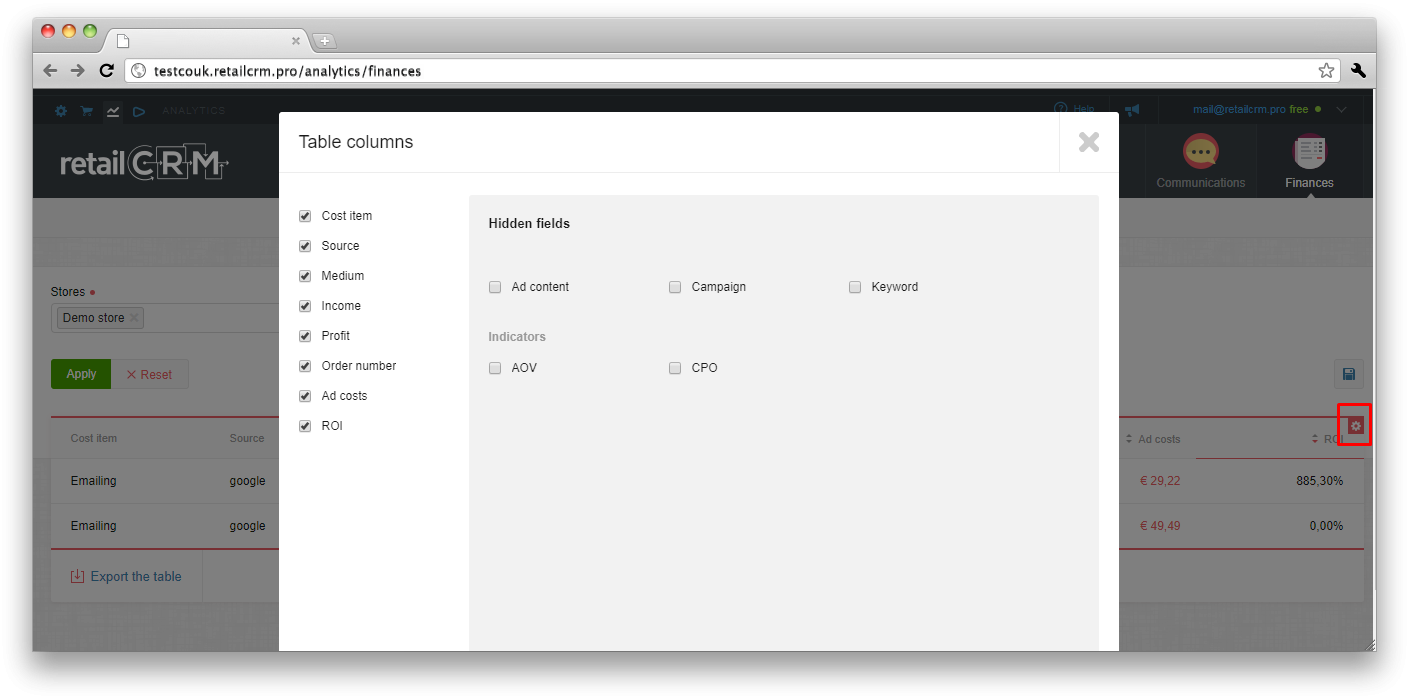
For each tab in report table you can add or remove additional columns for displaying necessary information, using gear icon at the top right corner of table. At screenshot below you can see “Table columns” window, chosen columns are marked blue, columns, which you can add, are marked green.
In this settings you can set the fields, by which the orders and advertising costs will be matched. There is detailing by:
If only one field is enabled (for example, Source), costs and income will be displayed by all orders came from this source independently of different mediums/campaigns, etc. The system will sum all data, based on “Source” field only. If 2 and more fields are enabled, then the system will detail costs sum and match it with orders income according to the set of enabled fields.
In the left (text) part of report you can see data on advertising cost items, sources, mediums of getting orders. Displaying and detailing of marketing cost items depends on the set of utm-marks used by the user. In the right part you can see calculated values of indicators. In this report you can see by each marketing cost items:
If ROI is lower than 100%, it means that advertising is not efficient (1 euro of advertising costs gives less than 1 euro of profit to the store). And contrary, if ROI is higher than 100%, it means that advertising is efficient.