In this section you can see what functions are on “Communications” page.
Section "Operating communications" is responsible for personal sending of letters and SMS from customer or order card. Please note that the trigger sending letters/SMS is also considered to be “Operating communications”.
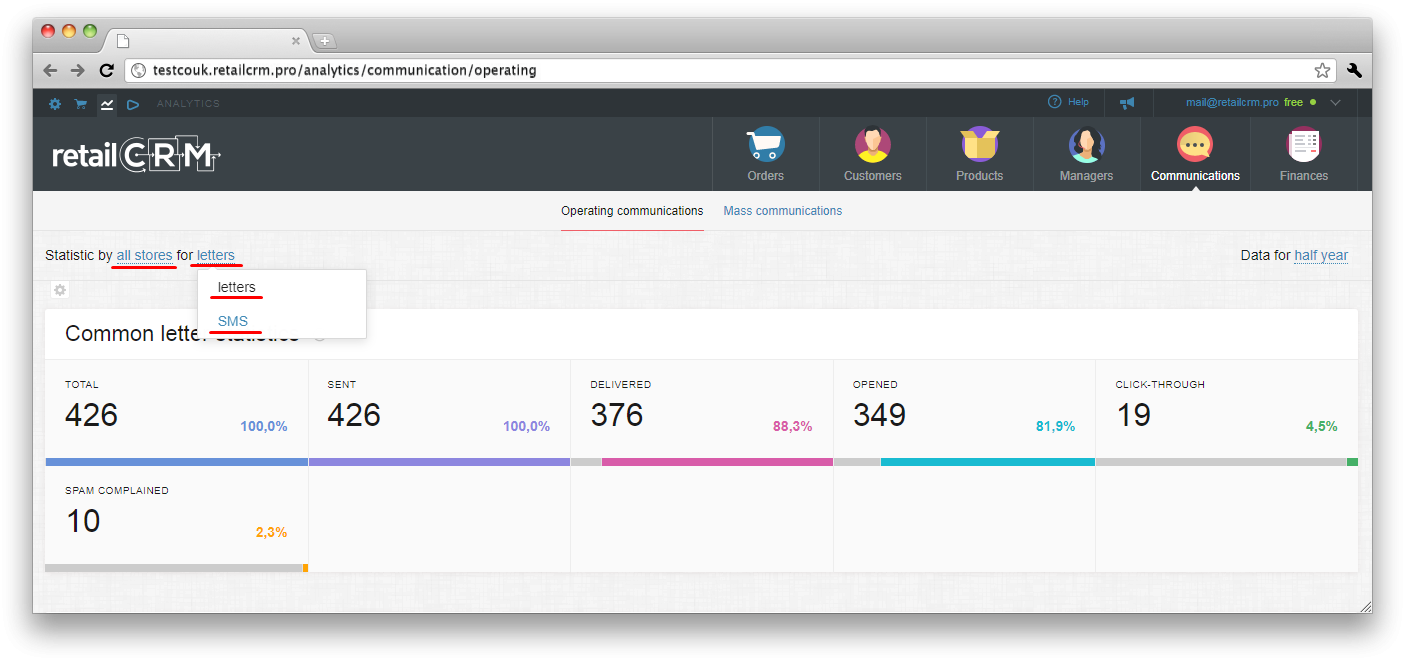
You can see statistics on letters or SMS by all stores or by certain store in “Operating communication” section.
There is also opportunity to choose time interval for getting data. You can set interval in certain dates or in relative dates, for example, month, today. Also you can see data by all the time.

There is a gear icon under statistics settings. Clicking on it, you will see pop-up window “Panel settings”. There are 2 blocks available for settings:
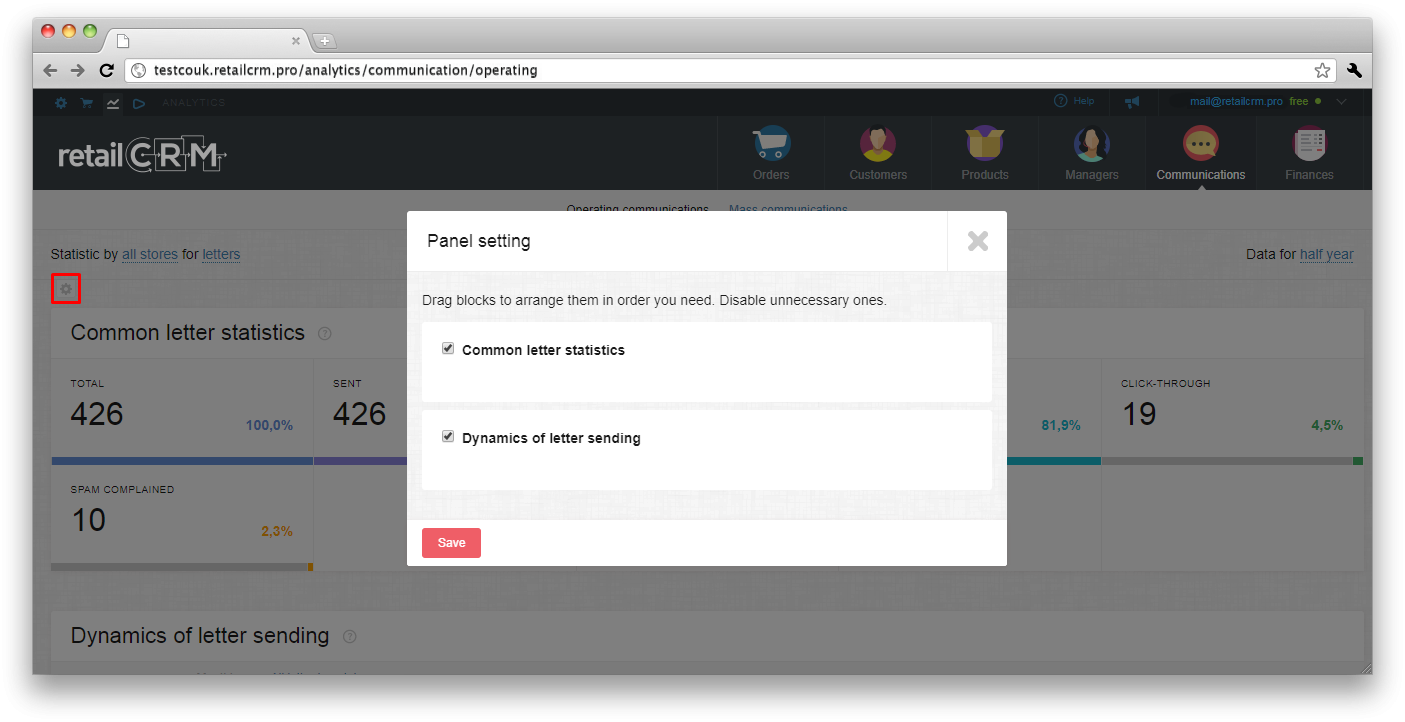
These blocks can be disabled or enabled by clicking on them. Also blocks can be moved by drag-and-drop.
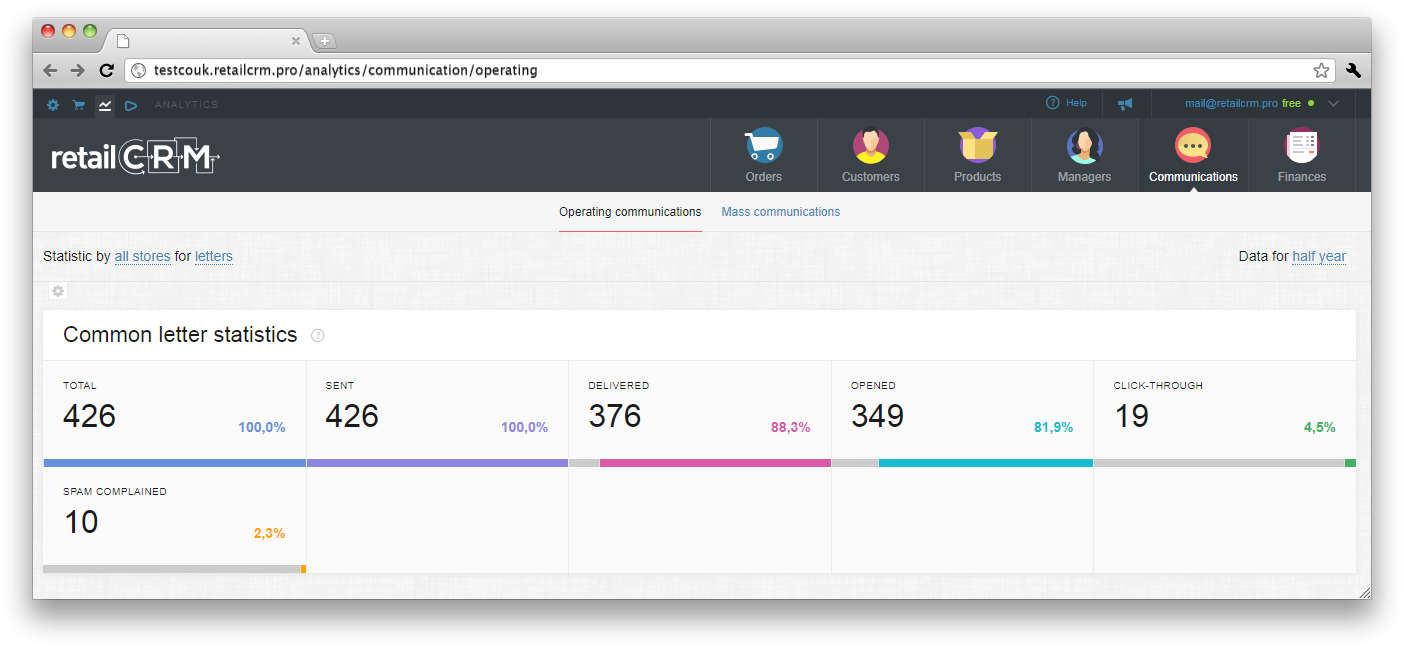
This widget shows common data on sent letters (including in %), specifically:
Common letter statistics is the funnel of statuses, which shows transitions of letters statuses in percentage. For example, we can see that total quantity of letters is 426 (100%), 365 letters were delivered (85,7%), 345 - opened (81%), 20 - click-through (4,7%), 10 - spam-complained (2,3%).
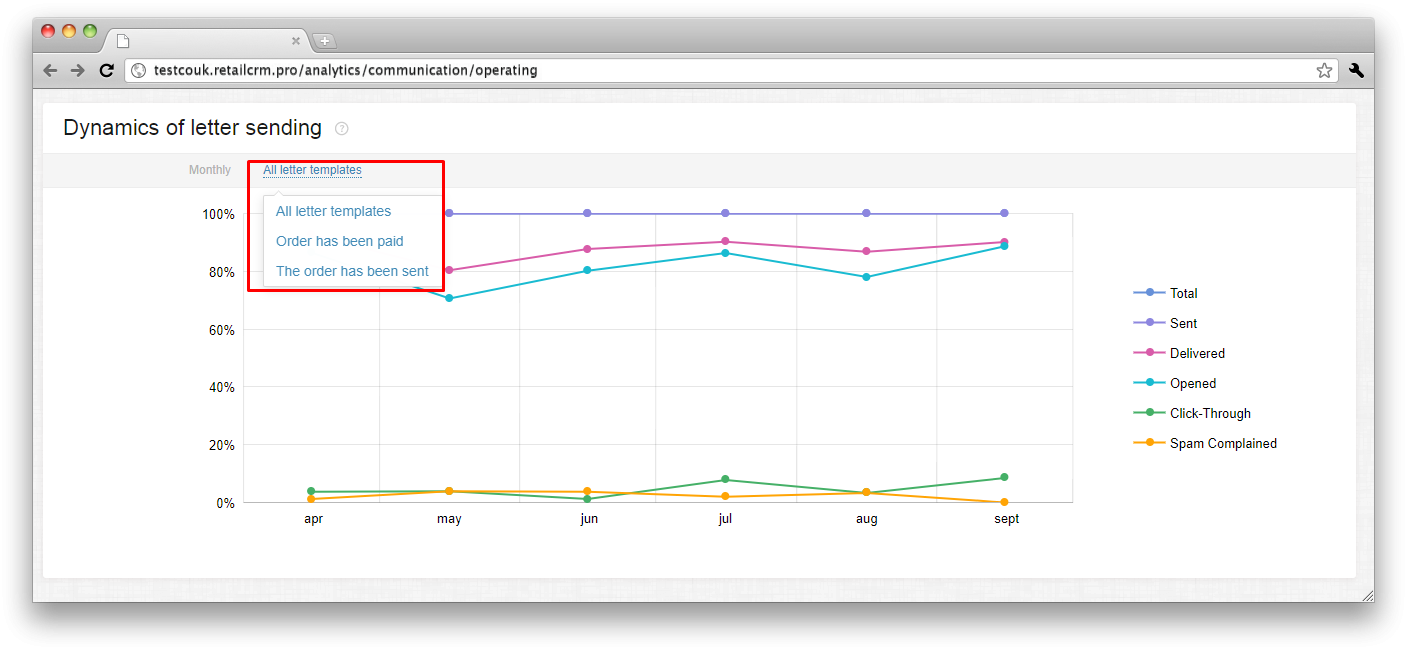
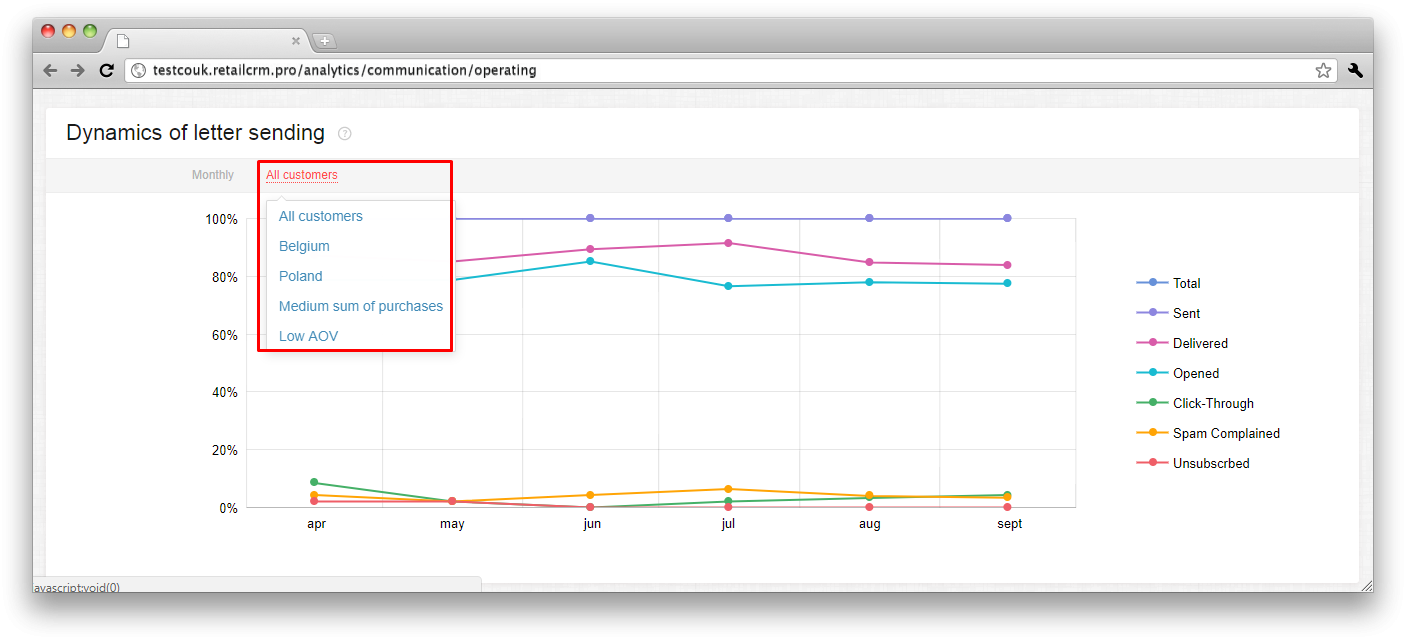
This widget shows graphically the dynamics of letter sending with specified level of detailing.
Dynamics can be displayed by templates depending on the certain system.
If small time period for data displaying was selected, dynamics can be displayed by weeks or days.
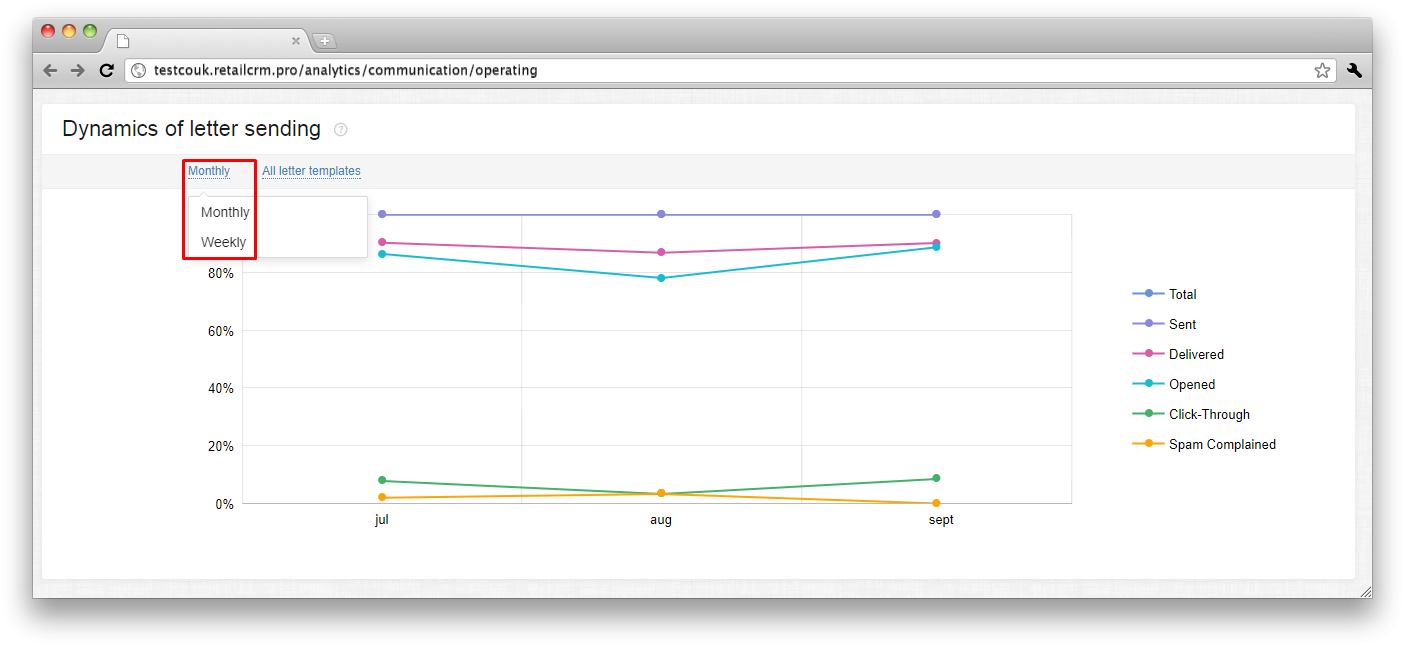
There is dynamics by months on X scale, and in percentage on Y scale.
Clarifications with description of each color on graph are on the right. Clicking on it, you can enable or disable the lines on graph.
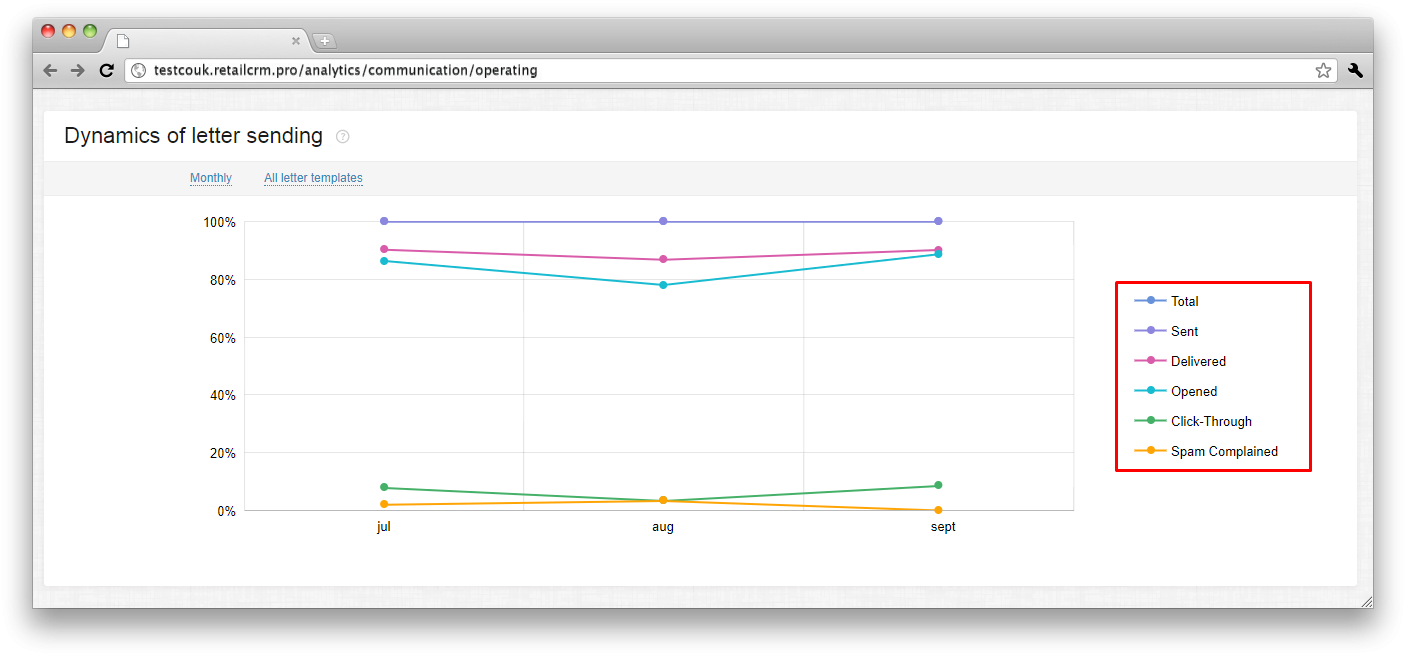
When hovering on appropriate lines of graph, you will see also concrete numbers besides percentage, for example, delivered: 82,4% (42).

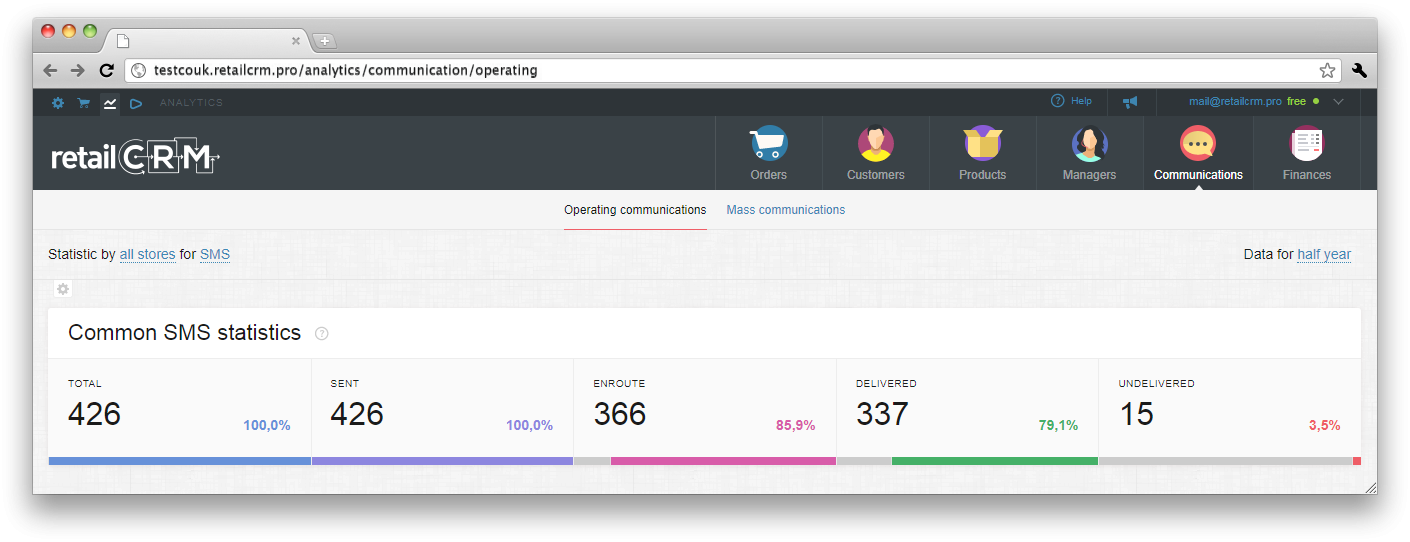
This widget shows common data on sent SMS, specifically:
Common SMS statistics is the funnel of statuses, which shows transitions of SMS statuses in percentage. For example, we can see that total quantity of SMS is 426 (100%), sent - 426 (100%), enroute - 366 (85,9%), delivered - 337 (79,1%), undelivered - 15 (3,5%).
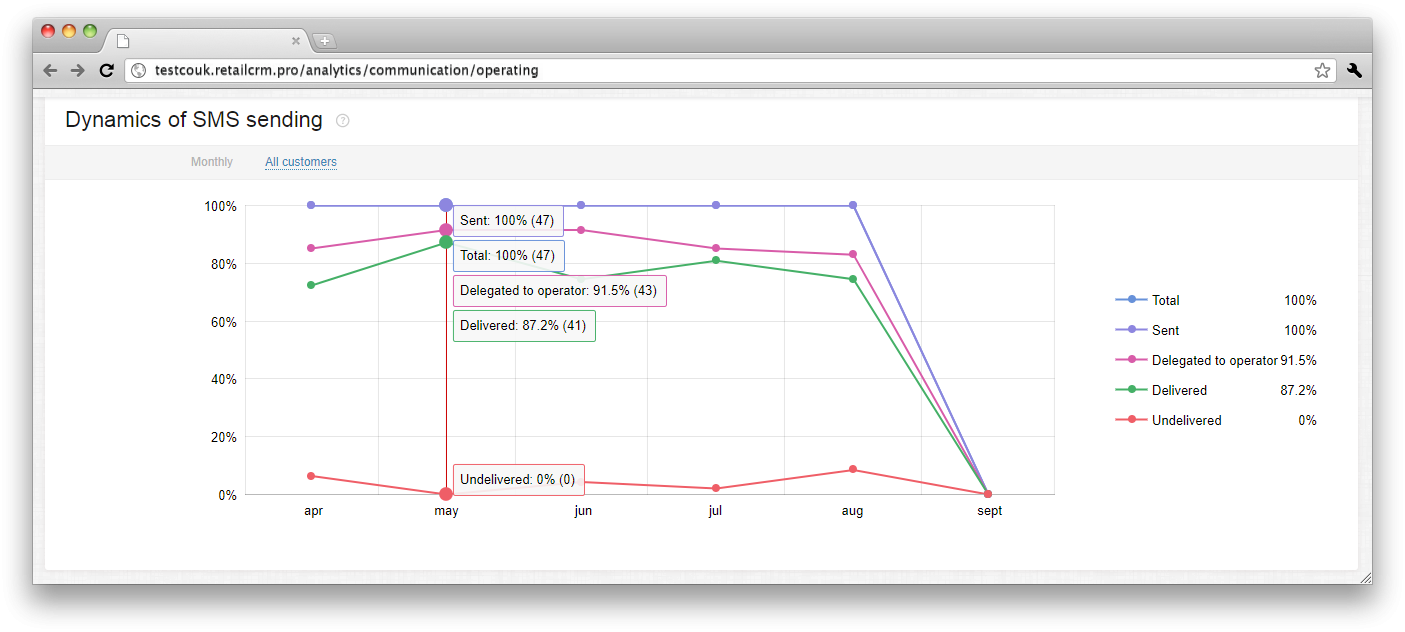
This widget shows graphically the dynamics of SMS sending with specified level of detailing. Dynamics can be displayed by:
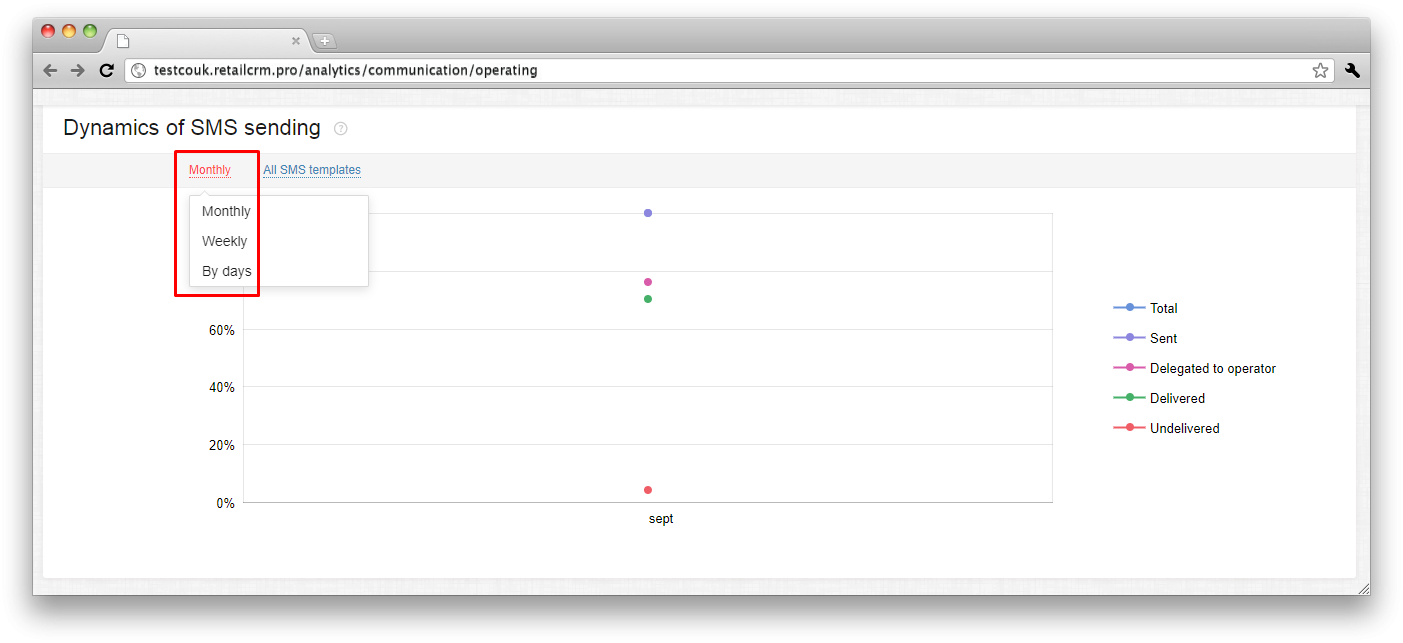
Dynamics can be displayed by templates depending on the certain system.
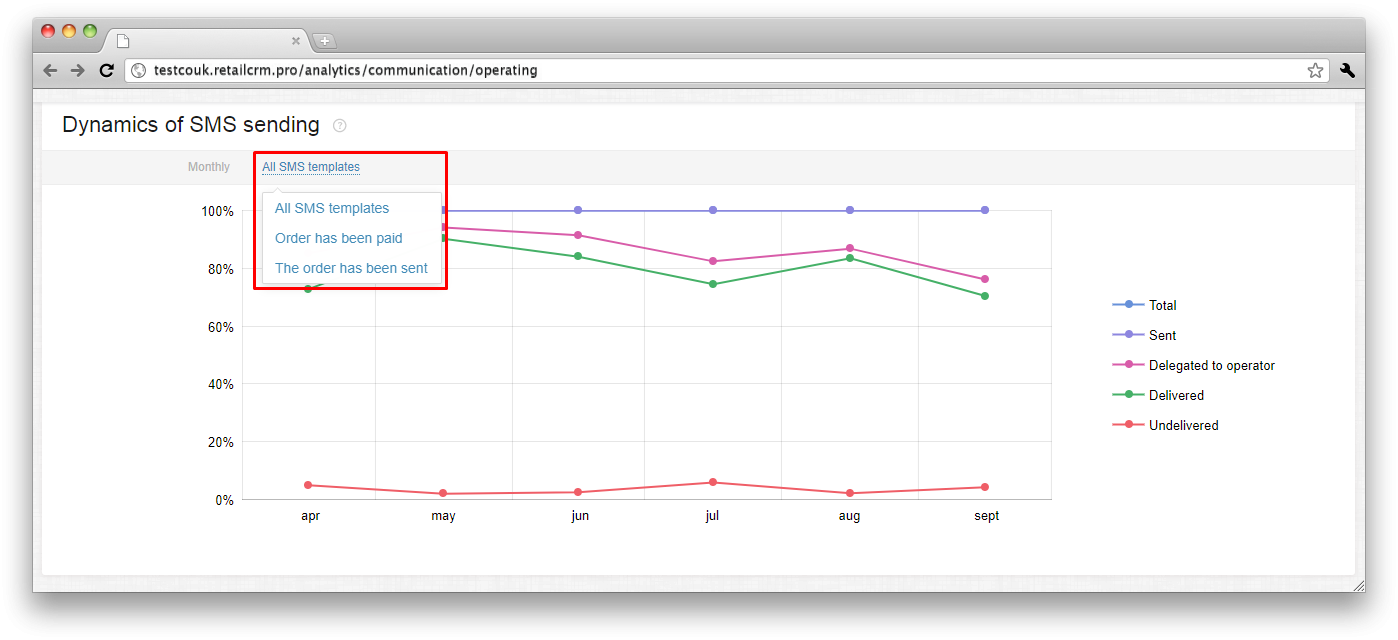
On the right, same as in dynamics of letter sending, you can see clarifications for each color on graph, which can be disabled if necessary, by clicking on needed clarification.

When hovering on appropriate lines of graph, you will see also concrete numbers besides percentage, for example, delivered: 84% (68).

Section "Mass communications " is responsible for mass sending of letters and SMS from Marketing block in retailCRM.
In “Mass communications” section you can see statistics on letters or SMS by all stores or on any certain store.

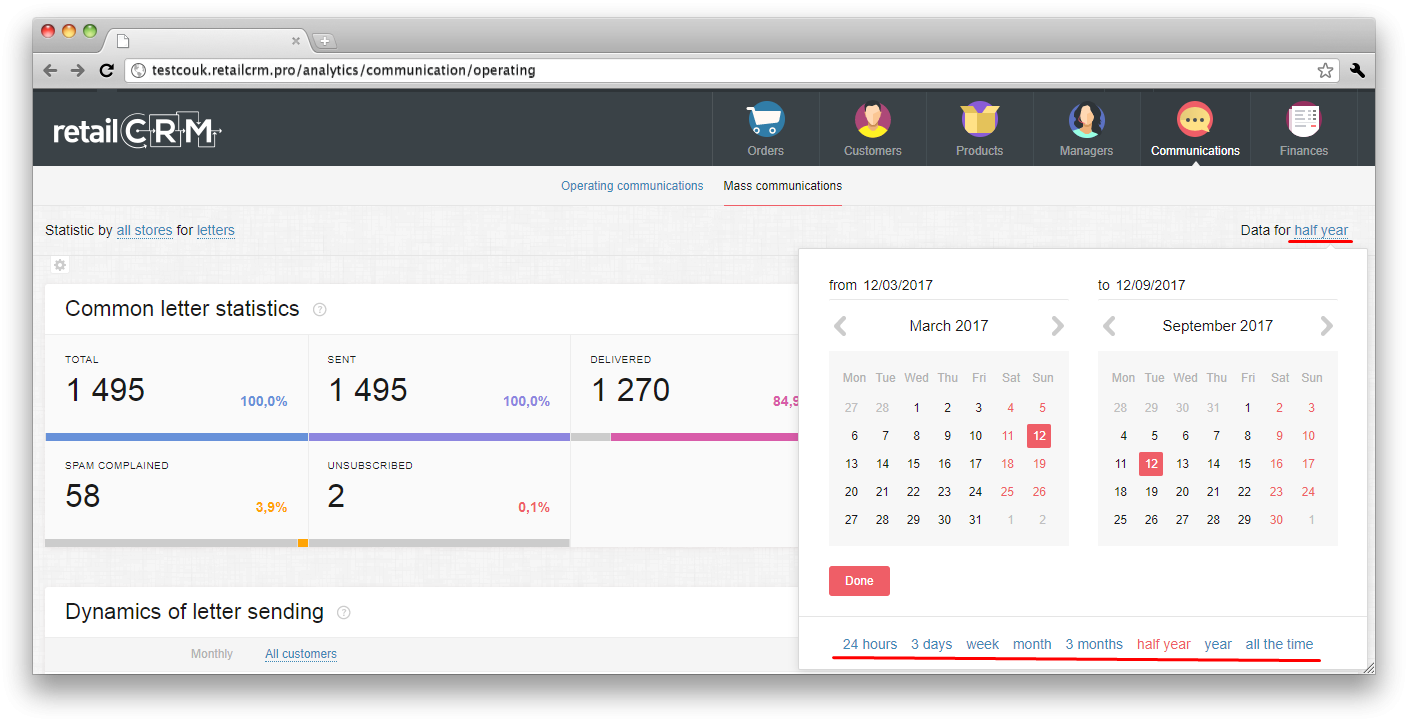
There is also opportunity to choose time interval for getting data. You can set interval in certain dates or in relative dates, for example, month, today. Also you can see data by all the time.
There is a gear icon under statistics settings. Clicking on it, you will see pop-up window “Panel settings”. There are 3 blocks available for settings:
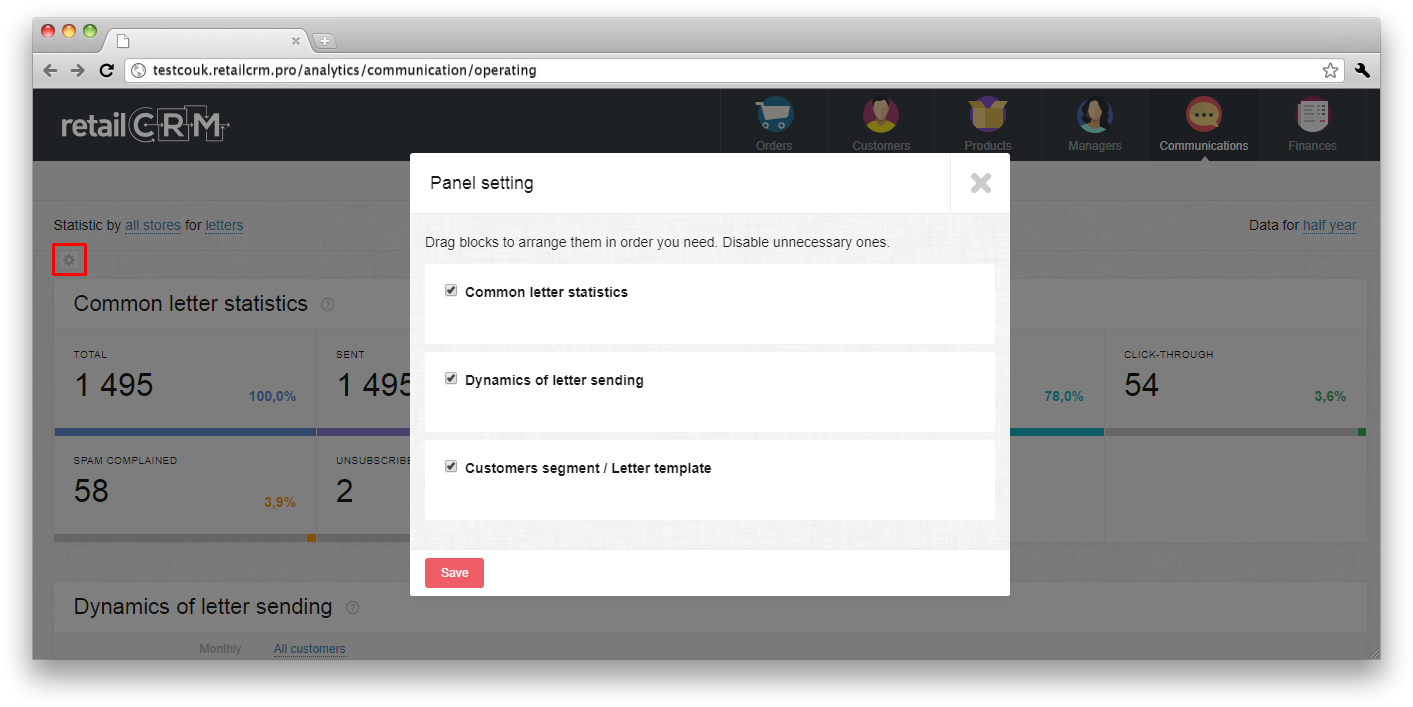
These blocks can be disabled or enabled by clicking on them. Also blocks can be moved by drag-and-drop.
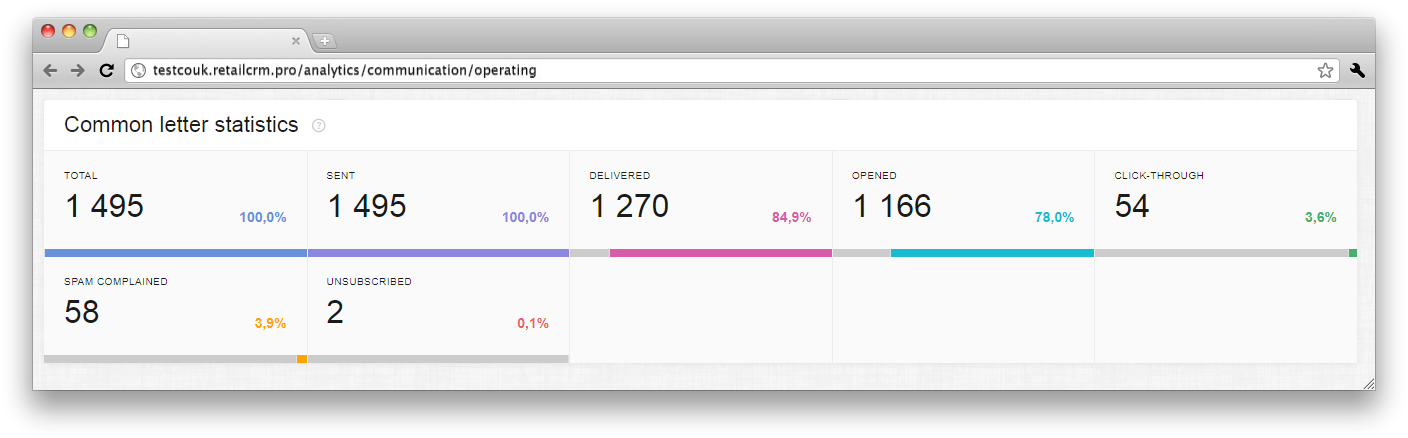
This widget shows common data on sent letters (including in %), specifically:
Common letter statistics is the funnel of statuses, which shows transitions of letters statuses in percentage. For example, we can see that total quantity of letters is 1495 (100%), 1270 letters were delivered (84,9%), 1166 - opened (78%), 54 - click-through (3,6%), 58 - spam-complained (3,9%), 2 - unsubscribed (0,1%).
Note: automatic unsubscriptions of customers are not considered in analytics on unsubscriptions.
This widget shows graphically the dynamics of letter sending with specified level of detailing.
Dynamics can be shown by different segments, which you can see on the left in drop-down list.
On the right, same as in dynamics in operating communications, you can see clarifications for each color on graph, which can be disabled if necessary, by clicking on needed clarification.

When hovering on appropriate lines of graph, you will see also concrete numbers besides percentage, for example, delivered: 84,8% (714).

This widget shows information on certain mailing campaign.
Graph can be displayed by different segments, the list of segments is on the left in drop-down list.

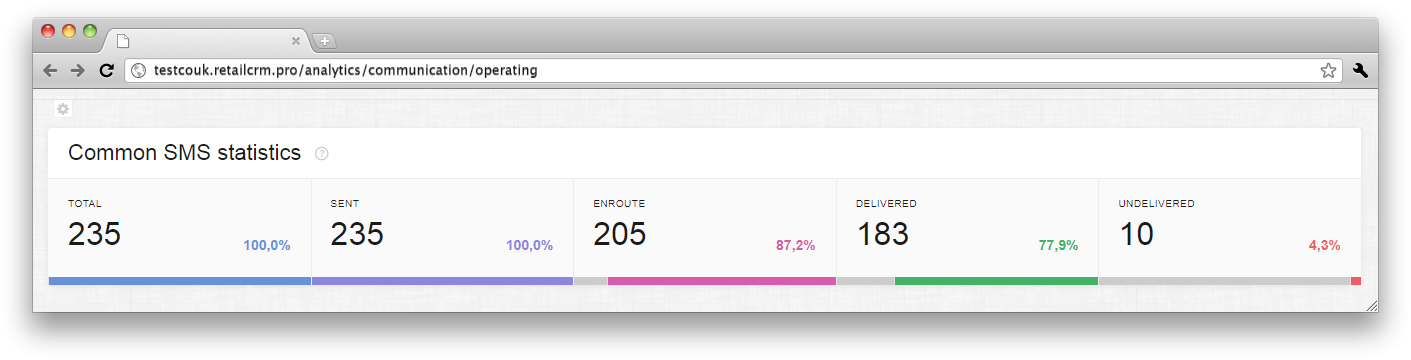
This widget shows common data on sent SMS, specifically:
Common SMS statistics is the funnel of statuses, which shows transitions of SMS statuses in percentage. For example, we can see that total quantity of SMS is 235 (100%), sent - 235 (100%), enroute - 205 (87,2%), delivered - 183 (77,9%), undelivered - 10 (4,3%).
This widget shows graphically the dynamics of SMS sending with specified level of detailing. Dynamics can be displayed by different segments, the list of segments is on the left in drop-down list.
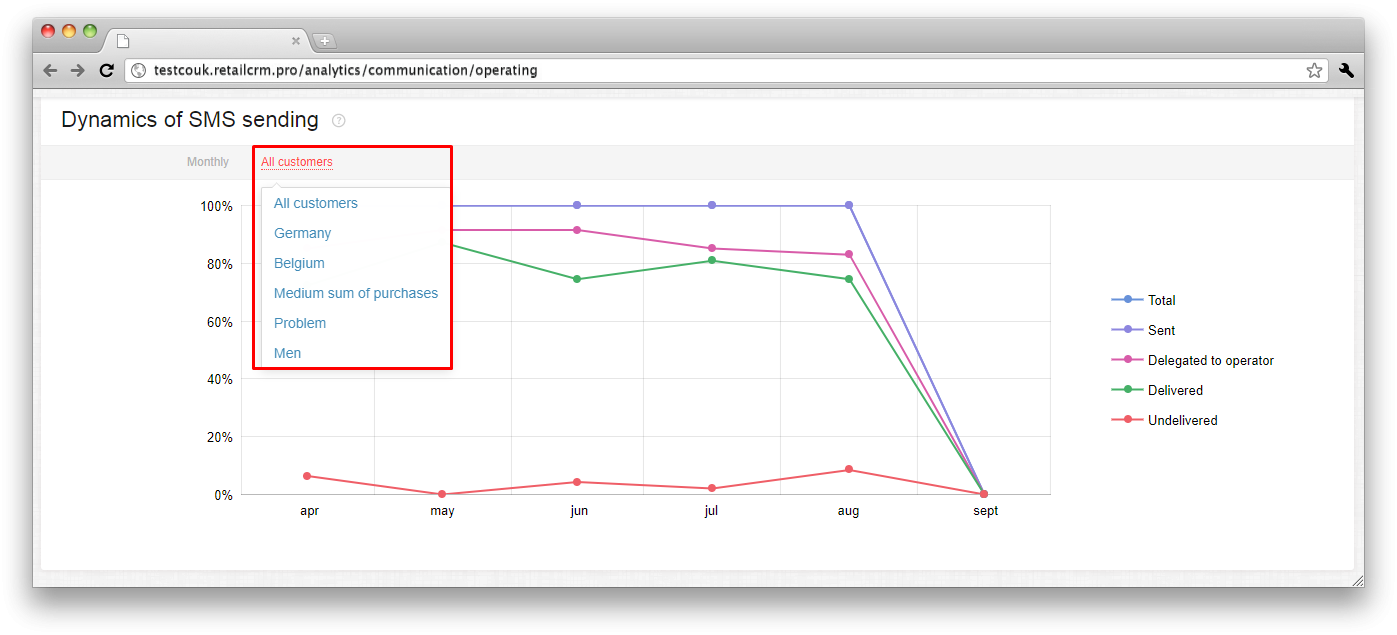
On the right, same as in dynamics of letter sending, you can see clarifications for each color on graph, which can be disabled if necessary, by clicking on needed clarification.
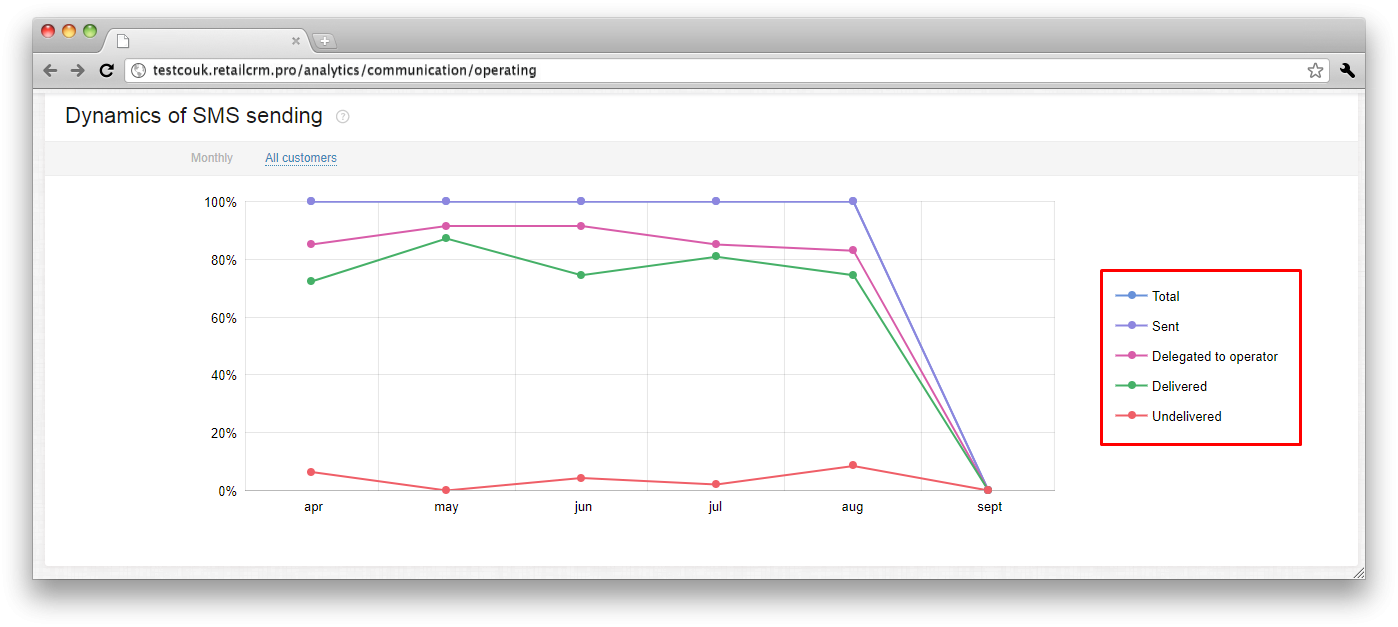
When hovering on appropriate lines of graph, you will see also concrete numbers besides percentage, for example, delivered: 87,2% (41).
This widget shows information on concrete SMS mailing.
Graph can be displayed by different dates, the list of dates is on the left in drop-down list.
